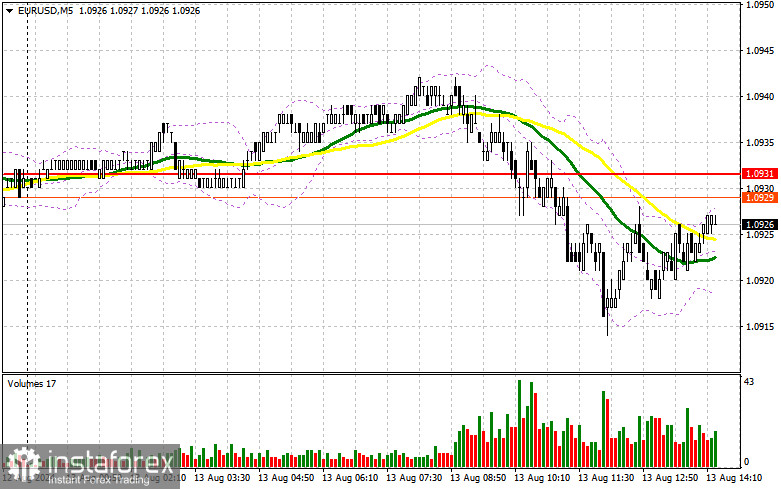
In my morning forecast, I highlighted the 1.0931 level and planned to base my trading decisions on it. Let's look at the 5-minute chart and analyze what happened. The decline around 1.0931 occurred, but a false breakout did not form there. For this reason, I remained out of the market during the first half of the day. The technical outlook was reassessed for the second half of the day.

For Opening Long Positions on EUR/USD:
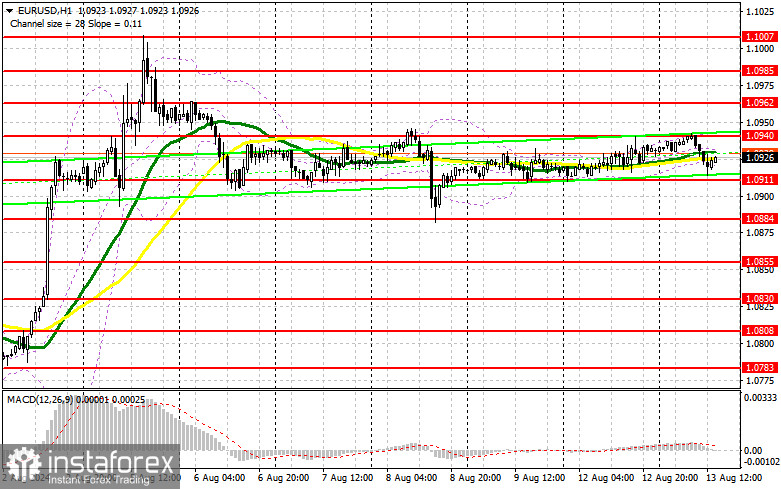
The euro predictably declined in response to the ZEW index data for the eurozone and Germany, after which the pressure eased, stabilizing the market. Traders remain without clear guidance, which affects market volatility. In the second half of the day, we expect a more significant report on the U.S. Producer Price Index (PPI) and the NFIB Small Business Optimism Index. The speech by FOMC member Raphael Bostic will also attract attention, especially if the data shows a decrease in producer prices, strengthening the argument for a half-point rate cut in September. For opening long positions, I prefer to wait for a decline and the formation of a false breakout around the new support level of 1.0911, formed based on yesterday's results. The target will be growth and a retest of the 1.0940 resistance level, where I expect the first sign of euro sellers. A breakout followed by a retest from above will lead to further strengthening of the pair, with a chance to rise toward 1.0962. The ultimate target will be the high at 1.0985, where I plan to take profit. If EUR/USD declines and shows no activity around 1.0911 in the second half of the day, sellers will regain control and begin to build a downward trend. In this case, I will only enter after a false breakout forms around 1.0884. I plan to open long positions immediately on a rebound from 1.0855, targeting an upward correction of 30-35 points within the day.
For Opening Short Positions on EUR/USD:
Sellers continue to maintain control. Defending 1.0940 along with a false breakout would be an appropriate scenario for opening short positions with the target of falling to the support at 1.0911. A breakout and consolidation below this range, along with a bottom-up retest, will provide another selling point with a move toward 1.0884, where I expect more active buyer interest. The furthest target will be the area around 1.0855, where I plan to take profit. Testing this level will undermine the euro buyers' efforts to establish an upward trend. In the event of an upward move in EUR/USD in the second half of the day and a lack of sellers at 1.0940, buyers will have a chance to regain the initiative. In this case, I will postpone sales until testing the next resistance at 1.0962. I will also act there, but only after a failed consolidation. I plan to open short positions immediately on a rebound from 1.0985, targeting a downward correction of 30-35 points.

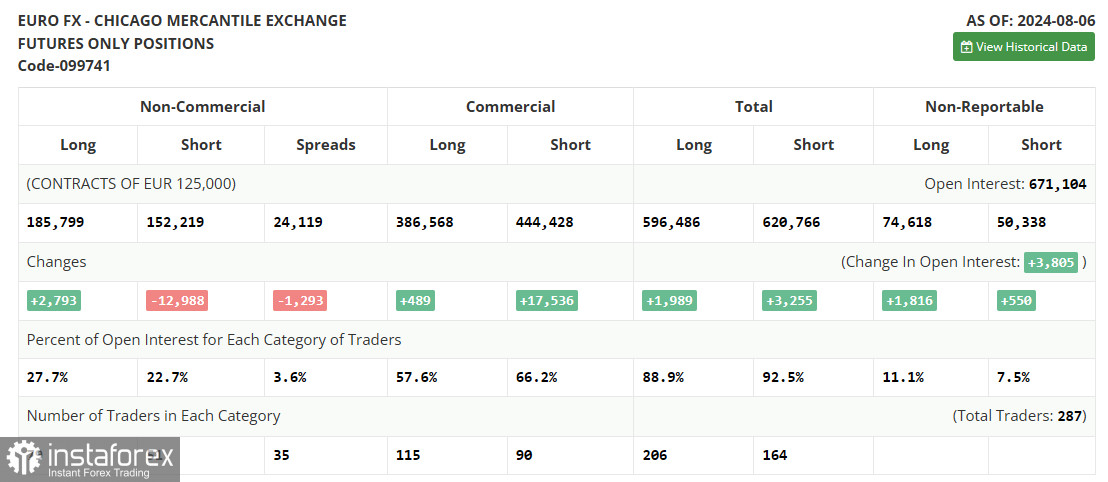
The COT report for August 6 showed an increase in long positions and a reduction in short positions. It is clear that the new course of the Federal Reserve System toward easing monetary policy has not gone unnoticed, and despite similar actions expected from the ECB, the euro has a good chance of recovering against the dollar, as the U.S. Federal Reserve might unexpectedly cut rates by half a percent in the fall. A series of statistics will soon be released that will determine the Fed's next steps, so keep a close eye on the economic calendar. The COT report indicates that long non-commercial positions rose by 2,793 to 185,799, while short non-commercial positions fell by 12,988 to 152,219. As a result, the gap between long and short positions decreased by 1,293.
Indicator Signals:
Moving Averages:Trading is conducted around the 30 and 50-day moving averages, indicating a sideways market.
Note: The period and prices of the moving averages considered by the author are on the H1 hourly chart and differ from the general definition of classic daily moving averages on the D1 daily chart.
Bollinger Bands:In case of a decline, the lower boundary of the indicator around 1.0910 will serve as support.
Indicator Descriptions:
- Moving Average (MA): Determines the current trend by smoothing volatility and noise. Period 50 is marked in yellow on the chart.
- Moving Average (MA): Determines the current trend by smoothing volatility and noise. Period 30 is marked in green on the chart.
- MACD (Moving Average Convergence/Divergence): Fast EMA period 12, Slow EMA period 26, SMA period 9.
- Bollinger Bands: Period 20.
- Non-commercial traders: Speculators such as individual traders, hedge funds, and large institutions using the futures market for speculative purposes and meeting certain criteria.
- Long non-commercial positions: Represent the total long open position of non-commercial traders.
- Short non-commercial positions: Represent the total short open position of non-commercial traders.
- Net non-commercial position: The difference between short and long positions of non-commercial traders.
 English
 Русский
 Bahasa Indonesia
 Bahasa Malay
 ไทย
ไทย Español
 Deutsch
 Български
 Français
 Tiếng Việt
 中文
中文 বাংলা
বাংলা हिन्दी
 Čeština
 Українська
 Română

