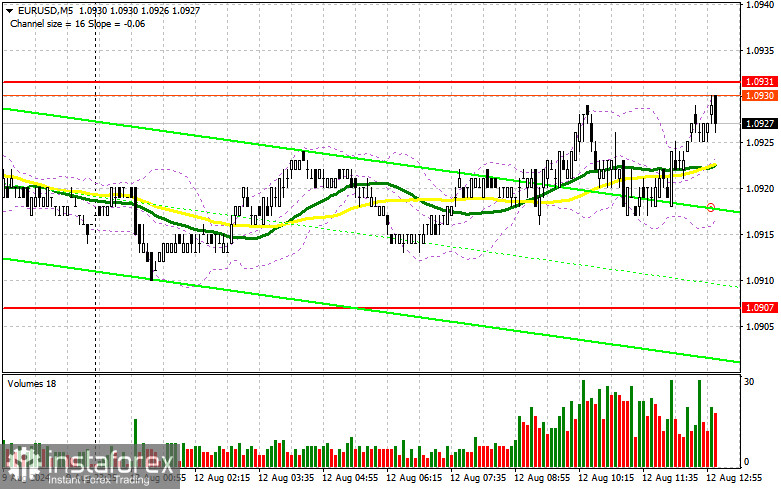
In my morning forecast, I focused on the 1.0931 level and planned to make trading decisions based on it. Let's look at the 5-minute chart and see what happened. There was a rise near 1.0931, but no false breakout was formed. As a result, I avoided trades in the first half of the day. The technical picture was not revised for the second half of the day.

To open long positions on EUR/USD:
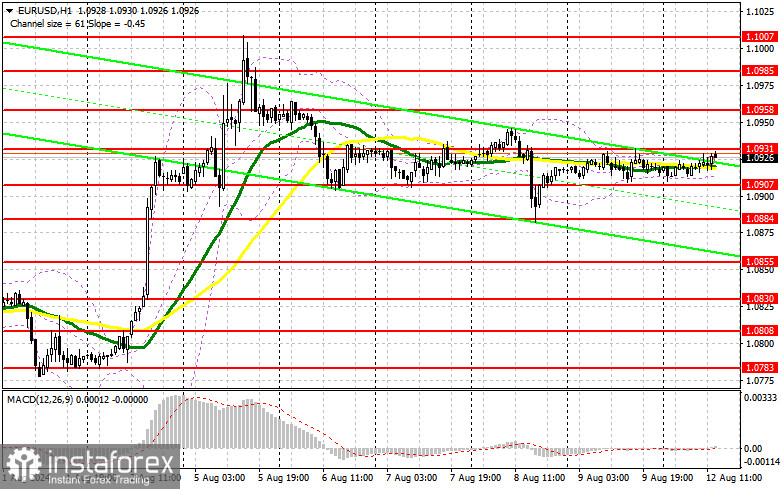
The data from Germany predictably did not lead to a spike in volatility, and considering there is no economic data in the second half of the day, the start of the week will likely be similar to the end of last week. For this reason, I won't rush into the market. I prefer to wait for a decline and the formation of a false breakout around the support level of 1.0907, formed at the end of last week, before opening long positions. The target will be to rise and update the resistance level at 1.0931, where I expect the first signs of euro sellers. A breakout followed by a retest of this range from above could strengthen the pair, increasing the chances of a rise toward the 1.0958 level. The furthest target would be the 1.0985 high, where I will take profits. If EUR/USD declines and there is no significant activity around 1.0907 in the second half of the day, sellers will regain the initiative and start building a downward trend. In this case, I will enter only after forming a false breakout around 1.0884. I plan to open long positions immediately on a rebound from 1.0855, targeting a 30-35 point upward correction within the day.
To open short positions on EUR/USD:
Sellers continue to maintain control. Considering the lack of significant U.S. statistics, protecting 1.0931, as was the case last Friday, combined with a false breakout, would be an appropriate scenario for opening short positions with a target of 1.0907 support. A breakout and consolidation below this range, along with a retest from below to above, will provide another selling point, targeting 1.0884, where I expect more active buyer involvement. The furthest target would be the 1.0855 level, where I will take profits. Testing this level would thwart the euro buyers' attempts to establish an upward trend. If EUR/USD rises in the second half of the day and sellers are absent at 1.0931, buyers will have a chance to regain the initiative. In that case, I will postpone selling until testing the next resistance at 1.0958. I will also take action there, but only after a failed consolidation. I plan to open short positions immediately on a rebound from 1.0985, targeting a 30-35 point downward correction.

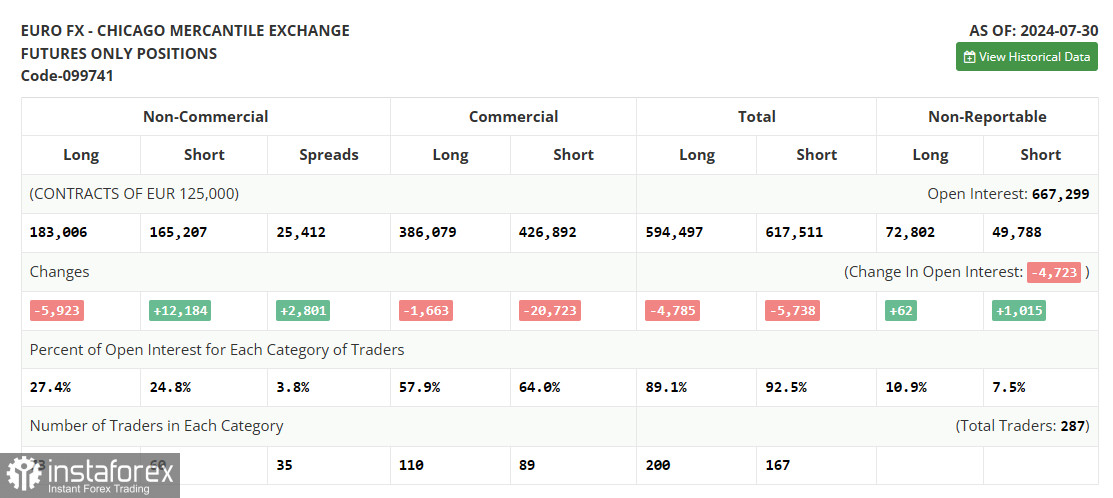
In the COT (Commitment of Traders) report for July 30, there was a reduction in long positions and a sharp increase in short positions. The ECB's decision to leave rates unchanged, with a clear hint at a September cut, coincided with the rather dovish stance of the Federal Reserve, which also indicated that rates may not stay at the same level in early autumn this year. Given the recent data on the U.S. economy, the Federal Reserve likely needed to act much sooner, which has led to the current panic observed in the stock market, as well as the risk of a recession next year, which is negative for the strength of the U.S. dollar. The COT report indicated that long non-commercial positions decreased by 5,923 to 183,006, while short non-commercial positions increased by 12,184 to 165,207. As a result, the gap between long and short positions increased by 2,801.

Indicator Signals:
- Moving Averages: Trading is conducted around the 30 and 50-day levels, suggesting a sideways market.
- Bollinger Bands: In the event of a decline, the lower boundary of the indicator around 1.0910 will act as support.
Indicator Descriptions:
- Moving Average: A moving average that determines the current trend by smoothing out volatility and noise. 50-period, marked in yellow on the chart.
- Moving Average: A moving average that determines the current trend by smoothing out volatility and noise. 30-period, marked in green on the chart.
- MACD Indicator: (Moving Average Convergence/Divergence) Fast EMA 12-period, Slow EMA 26-period, SMA 9-period.
- Bollinger Bands: 20-period.
- Non-commercial traders: Speculators such as individual traders, hedge funds, and large institutions using the futures market for speculative purposes.
- Long non-commercial positions: Represent the total long open position of non-commercial traders.
- Short non-commercial positions: Represent the total short open position of non-commercial traders.
- Total non-commercial net position: The difference between short and long positions of non-commercial traders.
 English
 Русский
 Bahasa Indonesia
 Bahasa Malay
 ไทย
ไทย Español
 Deutsch
 Български
 Français
 Tiếng Việt
 中文
中文 বাংলা
বাংলা हिन्दी
 Čeština
 Українська
 Română

