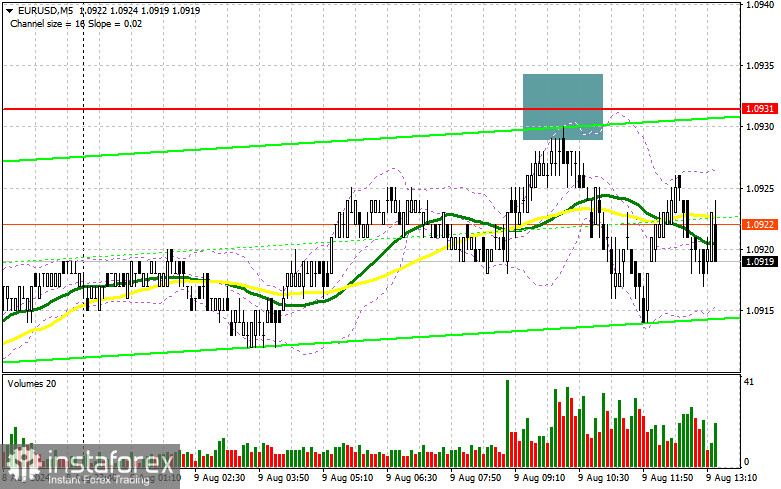
In my morning forecast, I focused on the level of 1.0931 and planned to make trading decisions from that point. We should examine the 5-minute chart and analyze what happened. The price rose to the area of 1.0931, but there was no false breakout, so I did not enter the market in the first half of the day. As a result, I did not enter any trades during the morning session. The technical picture was not revised for the second half of the day.
To Open Long Positions on EUR/USD:
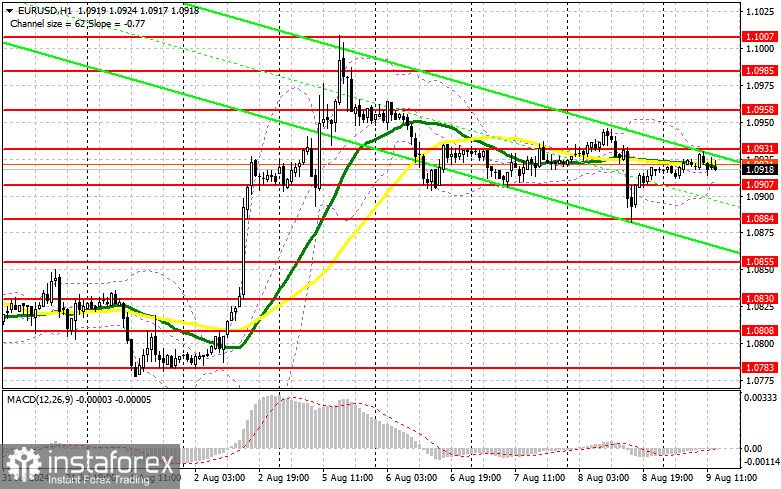
The data from Germany and Italy did not trigger a spike in volatility as expected. Given that there are no significant statistics in the afternoon, the end of the week is likely to be quite dull and uneventful. Therefore, I won't rush to enter the market. I prefer to wait for a decline and the formation of a false breakout around the new support level at 1.0907, formed based on yesterday's results. The target will be a rise and a retest of the new resistance at 1.0931, where I expect sellers to begin emerging. A breakout and a subsequent retest of this range from top to bottom could strengthen the pair, with a chance to rise towards 1.0958. The furthest target would be the maximum at 1.0985, where I will fix profits. If EUR/USD declines and there is no activity around 1.0907 in the second half of the day, sellers will regain the initiative and start building a downward trend. In that case, I will only consider entering after a false breakout around 1.0884. I plan to open long positions immediately on a rebound from 1.0855, with the target of an intraday correction of 30-35 points.
To Open Short Positions on EUR/USD:
Sellers continue to maintain the initiative. Given the lack of significant U.S. statistics, defending 1.0931 with a false breakout would be a suitable scenario for opening short positions with the target of falling to the support at 1.0907, formed based on yesterday's results. A breakout and consolidation below this range, followed by a retest from the bottom up, will provide another entry point for selling with movement towards 1.0884, where I expect to see more active buyers. The furthest target would be the area of 1.0855, where I will fix profits. Testing this level will negate buyers' plans to build an uptrend. If EUR/USD rises in the second half of the day and there are no bears at 1.0931, buyers will have a chance to regain the initiative. In that case, I will postpone sales until testing the next resistance at 1.0958. I also plan to act there, but only after an unsuccessful consolidation. I plan to open short positions immediately on a rebound from 1.0985, targeting a short-term downward correction of 30-35 points.
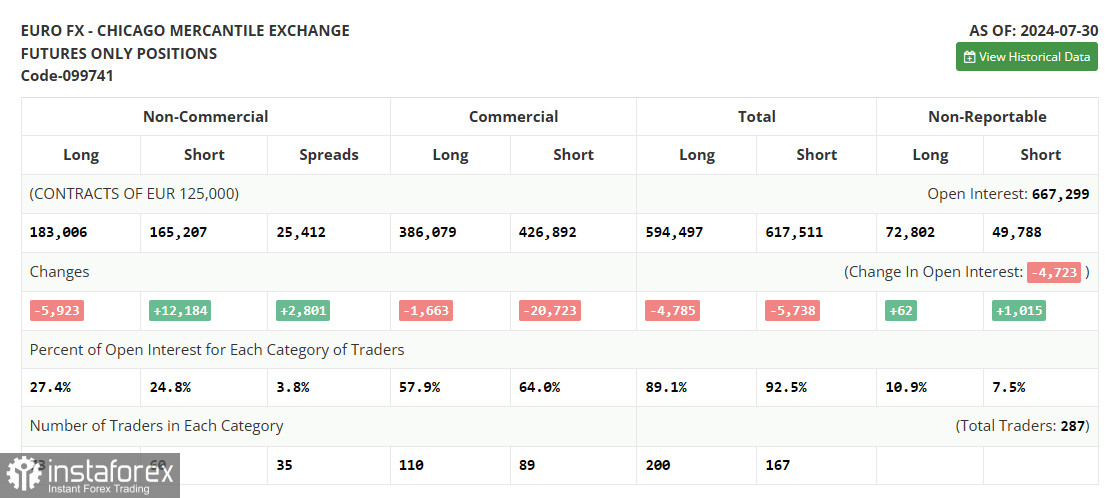
In the COT report (Commitment of Traders) for July 30, there was a decrease in long positions and a significant increase in short positions. The ECB's decision to leave rates unchanged with a direct hint at their reduction in September coincided with the rather dovish position of the Federal Reserve, which also indicated that it would not leave rates unchanged in early autumn this year. Considering the recent data on the U.S. economy, the regulator likely needed to act much earlier, leading to the panic that is currently observed in the stock market and the risk of a recession next year, which is unfavorable for the strength of the U.S. dollar. The COT report indicated that long non-commercial positions decreased by 5,923 to 183,006, while short non-commercial positions increased by 12,184 to 165,207. As a result, the spread between long and short positions widened by 2,801.
Indicator Signals:
Moving Averages:
Trading is taking place around the 30 and 50-day moving averages, indicating a sideways market.
Note: The period and prices of the moving averages are considered by the author on the H1 hourly chart and differ from the general definition of classic daily moving averages on the D1 daily chart.
Bollinger Bands:
If the price declines, the lower boundary of the indicator around 1.0919 will act as support.
Indicator Descriptions:
- Moving average (MA): Determines the current trend by smoothing volatility and noise. Period 50. Marked in yellow on the chart.
- Moving average (MA): Determines the current trend by smoothing volatility and noise. Period 30. Marked in green on the chart.
- MACD (Moving Average Convergence/Divergence): Fast EMA period 12. Slow EMA period 26. SMA period 9.
- Bollinger Bands: Period 20.
- Non-commercial traders: Speculators such as individual traders, hedge funds, and large institutions that use the futures market for speculative purposes and meet specific requirements.
- Long non-commercial positions: The total long open position of non-commercial traders.
- Short non-commercial positions: The total short open position of non-commercial traders.
- Total non-commercial net position: The difference between long and short positions of non-commercial traders.
 English
 Русский
 Bahasa Indonesia
 Bahasa Malay
 ไทย
ไทย Español
 Deutsch
 Български
 Français
 Tiếng Việt
 中文
中文 বাংলা
বাংলা हिन्दी
 Čeština
 Українська
 Română


