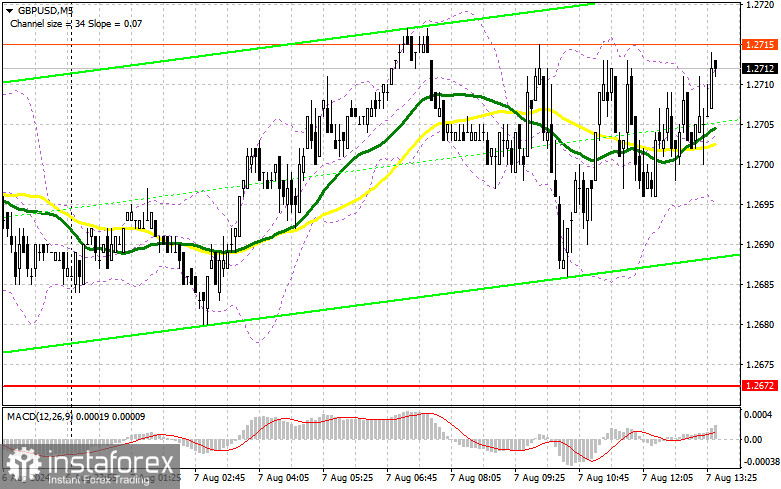
In my morning forecast, I highlighted the level of 1.2722 and planned to make decisions about market entry from that point. Let's look at the 5-minute chart and analyze what happened. The rise occurred, but there was no test and false breakout at 1.2722, so I was left without trades in the first half of the day. Therefore, the technical picture for the second half of the day was not reviewed.

For Opening Long Positions on GBP/USD:
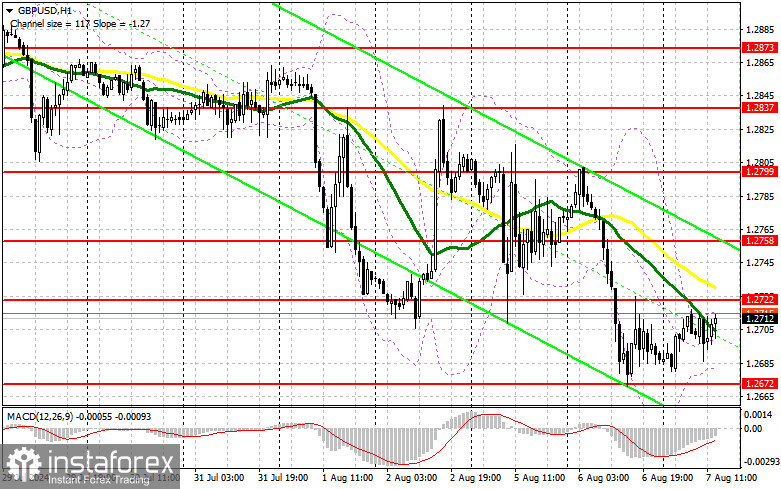
I would like to see more movement from the pound, but given the absence of important statistics from the U.S., this is unlikely to happen. However, it is quite possible that buyers will get a chance for a correction since no one wants to sell the pound anymore. But this correction is unlikely to be prolonged, so I prefer to act on the decline around the morning support at 1.2672, formed from yesterday. A false breakout will be a suitable option for opening long positions aiming for a correction to the resistance at 1.2722, which we did not reach. A breakout and reverse test from top to bottom of this range will increase the chances of a correction in the pound, leading to an entry point for long positions with the possibility of reaching the level of 1.2758. The furthest target will be the area of 1.2799, where I plan to take profits. If GBP/USD declines further and there is a lack of activity from the bulls at 1.2672 in the second half of the day, the situation for the pound will worsen. This will lead to a decline and update of the next support at 1.2643, increasing the chances of a larger fall in the pair. Therefore, only a false breakout will be a suitable condition for opening long positions. I plan to buy GBP/USD immediately on a rebound from the minimum of 1.2613, targeting a 30-35 point correction within the day.
For Opening Short Positions on GBP/USD:
Sellers maintain control over the market, but so far, we have not seen them in action. Only a false breakout at the resistance level of 1.2722 will convince of the presence of large players in the market betting on a further decline of the pound, providing an opportunity to open new short positions to continue the bearish trend with the target of updating the weekly low and support at 1.2672. A breakout and reverse test from bottom to top of this range will deal a blow to buyers' positions, leading to a stop order run and opening the way to 1.2643. The furthest target will be the area of 1.2613, where I will take profits. Testing this level will only strengthen the new bearish trend. In case of a rise in GBP/USD and a lack of activity at 1.2722 in the second half of the day, where the moving averages are also located, buyers will get a good chance to recoup losses and restore the pound to more acceptable levels. In this case, I will postpone sales until a false breakout at the level of 1.2758. If there is no movement downward, I will sell GBP/USD immediately on a rebound from 1.2799, but only expecting a downward correction of the pair by 30-35 points during the day.

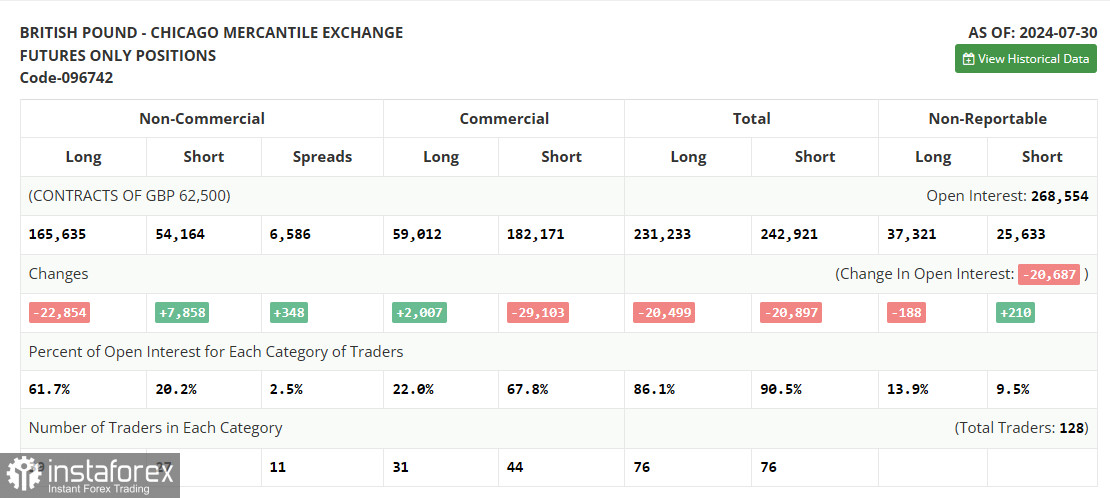
In the COT report (Commitment of Traders) for July 30, an increase in short positions and a reduction in long positions were observed. This change in the balance of power is not surprising since, according to the results of the Bank of England meeting, it clearly indicated that it intends to continue lowering interest rates. Now, more than ever, after managing inflation, the economy requires special support. The Federal Reserve's decision to keep interest rates unchanged, unlike the Bank of England, resulted in the fall of the pound, which will continue in the near future. The latest COT report states that long non-commercial positions fell by 22,854 to 165,635, while short non-commercial positions increased by 7,858 to 54,164. As a result, the spread between long and short positions increased by 348.
Indicator Signals:
Moving Averages:
Trading is conducted below the 30 and 50-day moving averages, indicating further decline of the pair.
Note: The period and prices of moving averages are considered by the author on the H1 hourly chart and differ from the general definition of classical daily moving averages on the D1 daily chart.
Bollinger Bands:
In case of a decline, the lower boundary of the indicator around 1.2680 will act as support.
Description of Indicators:
- Moving Average (MA): Determines the current trend by smoothing volatility and noise. Period 50. Marked in yellow on the chart.
- Moving Average (MA): Determines the current trend by smoothing volatility and noise. Period 30. Marked in green on the chart.
- MACD Indicator (Moving Average Convergence/Divergence): Quick EMA period 12, Slow EMA period 26, SMA period 9.
- Bollinger Bands: Period 20.
- Non-commercial traders: Speculators such as individual traders, hedge funds, and large institutions using the futures market for speculative purposes and meeting certain requirements.
- Long non-commercial positions: Represent the total long open position of non-commercial traders.
- Short non-commercial positions: Represent the total short open position of non-commercial traders.
- Total non-commercial net position: The difference between short and long positions of non-commercial traders.
 English
 Русский
 Bahasa Indonesia
 Bahasa Malay
 ไทย
ไทย Español
 Deutsch
 Български
 Français
 Tiếng Việt
 中文
中文 বাংলা
বাংলা हिन्दी
 Čeština
 Українська
 Română

