 English
  Русский
 Bahasa Indonesia
 Bahasa Malay
 ไทย
ไทย Español
 Deutsch
 Български
 Français
 Tiếng Việt
 中文
中文 বাংলা
বাংলা हिन्दी
 Čeština
 Українська
 Română

Analysis of macroeconomic reports:
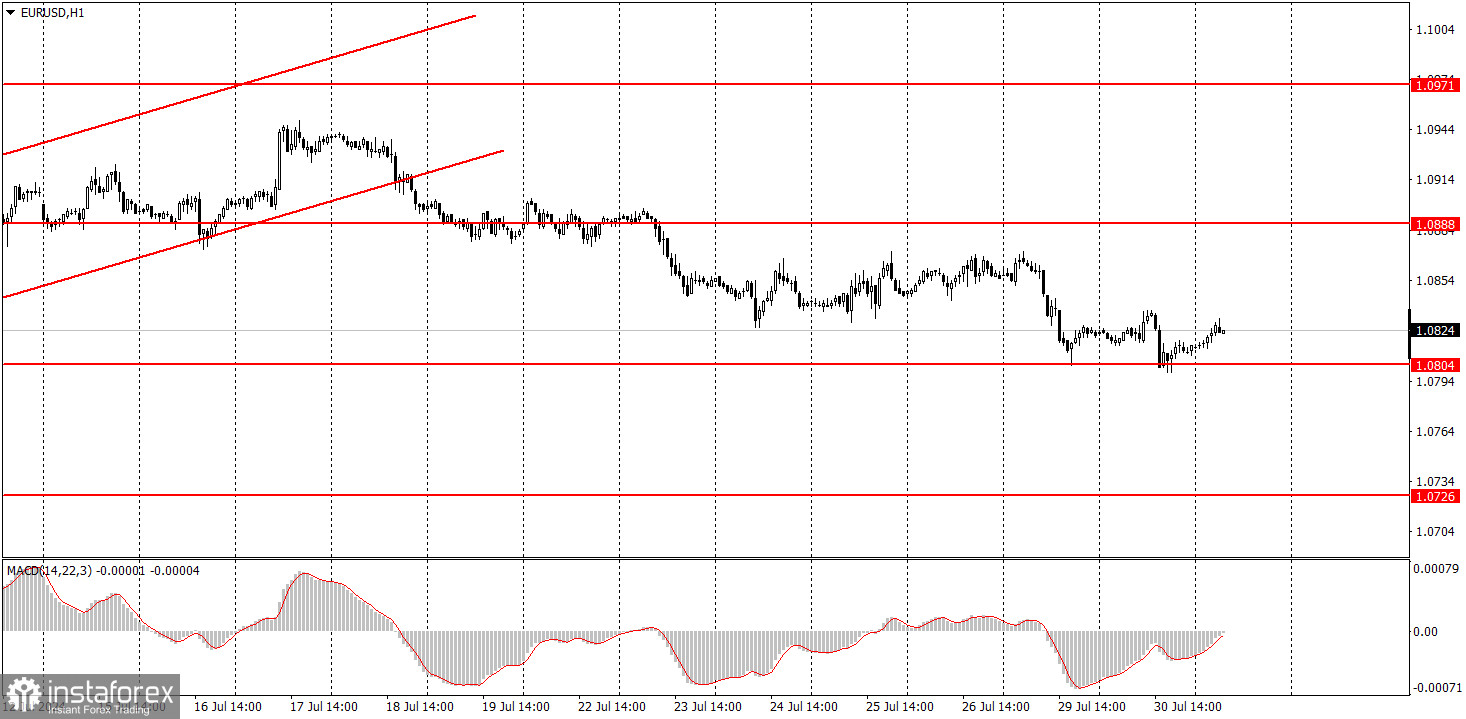
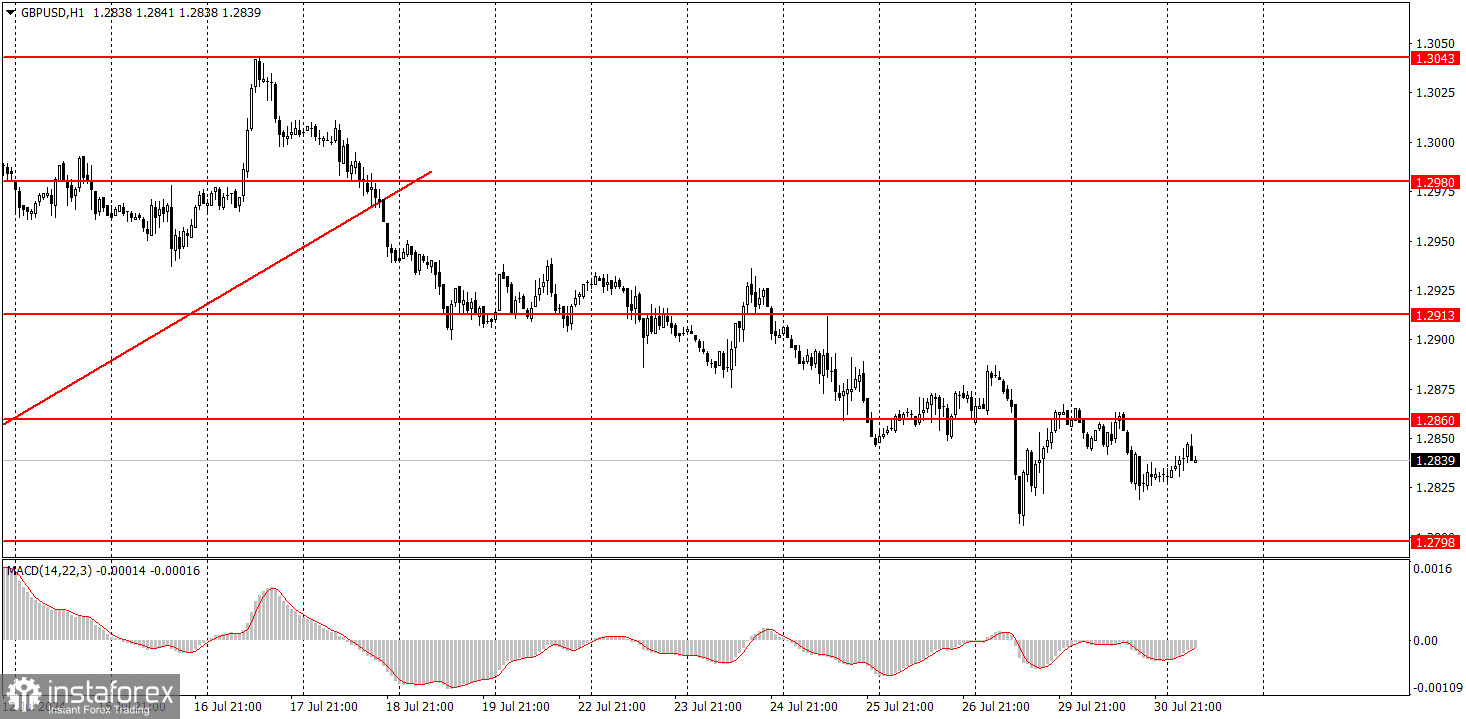
Many macroeconomic events are scheduled for Wednesday, but it's worth noting that there were already plenty of such events yesterday. Today, Germany will release unemployment data, the European Union will publish inflation figures, and the U.S. will present the ADP report on the labor market. However, yesterday, important reports on GDP and job vacancies only had a minor impact on both currency pairs' movement. Therefore, the problem is that the market is not ready to trade actively. The euro is between 1.06 and 1.10, so it will likely drift downward. The British pound is on track for a bearish correction amid the upcoming easing of the Bank of England's monetary policy.
Analysis of fundamental events:
Among Wednesday's fundamental events, we will highlight the Federal Reserve's meeting. However, beyond this, there's not much more to say. The key interest rate will remain unchanged, and the current level of inflation does not allow Fed Chair Jerome Powell to start promising a rate cut in September or even in the near future. Most likely, we will hear the usual set of phrases about progress in inflation, the strong economy and labor market, and the lack of need to rush into rate cuts.
General conclusions:
There will be considerable economic data today, but the market could easily ignore them. The problem is that the market is not in the mood for active movements. Even if the ADP report provokes a 20-pip reaction from traders, who cares? We should expect a surge of emotions from the Fed meeting, but even that is unlikely to be strong.
Basic rules of a trading system:
1) The strength of a signal is determined by the time it took for the signal to form (bounce or level breakthrough). The shorter the time required, the stronger the signal.
2) If two or more trades around a certain level are initiated based on false signals, subsequent signals from that level should be ignored.
3) In a flat market, any currency pair can produce multiple false signals or none at all. In any case, it's better to stop trading at the first signs of a flat market.
4) Trades should be opened between the start of the European session and mid-way through the U.S. session. All trades must be closed manually after this period.
5) In the hourly time frame, trades based on MACD signals are only advisable amidst substantial volatility and an established trend, confirmed either by a trendline or trend channel.
6) If two levels are too close to each other (from 5 to 20 pips), they should be considered as a support or resistance zone.
7) After moving 15 pips in the intended direction, the Stop Loss should be set to break-even.
What the charts show:
Support and Resistance price levels can serve as targets when buying or selling. You can place Take Profit levels near them.
Red lines represent channels or trend lines that depict the current trend and indicate the preferred trading direction.
The MACD (14,22,3) indicator, encompassing both the histogram and signal line, acts as an auxiliary tool and can also be used as a source of signals.
Important speeches and reports (always noted in the news calendar) can profoundly influence the price dynamics. Hence, trading during their release calls for heightened caution. It may be reasonable to exit the market to prevent abrupt price reversals against the prevailing trend.
Beginners should always remember that not every trade will yield profit. Establishing a clear strategy, coupled with effective money management, is key to long-term success in trading.