 English
  Русский
 Bahasa Indonesia
 Bahasa Malay
 ไทย
ไทย Español
 Deutsch
 Български
 Français
 Tiếng Việt
 中文
中文 বাংলা
বাংলা हिन्दी
 Čeština
 Українська
 Română

The EUR/USD pair continued its weak upward movement on Friday. The bulls managed to secure above the 76.4% correction level at 1.0858, which suggests a continuation of growth. However, I would not make such a conclusion. The bears are weak, but this week's information background will be very important. Sellers might receive unexpected help. Currently, trader activity is very weak, so I do not consider the signal around the 1.0858 level as a signal.
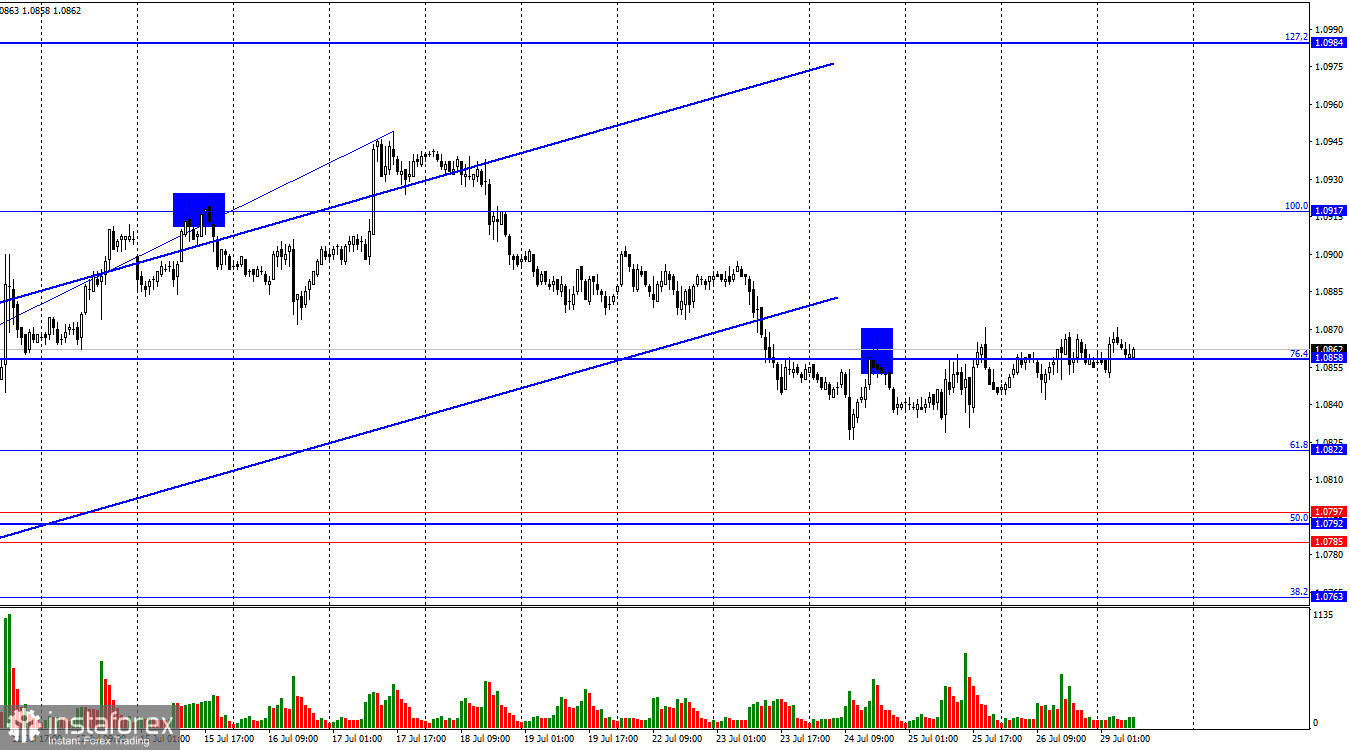
The wave situation has become a bit more complicated but still raises no questions. The last upward wave broke the peak of the previous wave and can be considered complete. Thus, the bears have started forming a corrective wave. For the "bullish" trend to be canceled, the bears need to break the low of the previous downward wave, which is around 1.0668. For this, they need to go down another 180 pips. With current trader activity, this might take 2-3 weeks, one of which has already passed. A rapid fall is clearly not expected.
Friday's information background supported the bears more than the bulls, but overall traders found nothing interesting or important in the American reports. In my opinion, the most important were the Personal Consumption Expenditures (PCE) Price Index and the University of Michigan Consumer Sentiment Index. Both indices were higher than expected, which could have supported the EUR/USD bears. However, as I mentioned, traders were not inclined towards active trading on Friday. They were already focused on this week when a series of important reports will be released in the Eurozone and the U.S. No interesting information is expected on Monday. Hence, traders are likely to continue waiting for the first important data. Graphical analysis allows for the continuation of weak growth, which can then sharply turn into a fall.
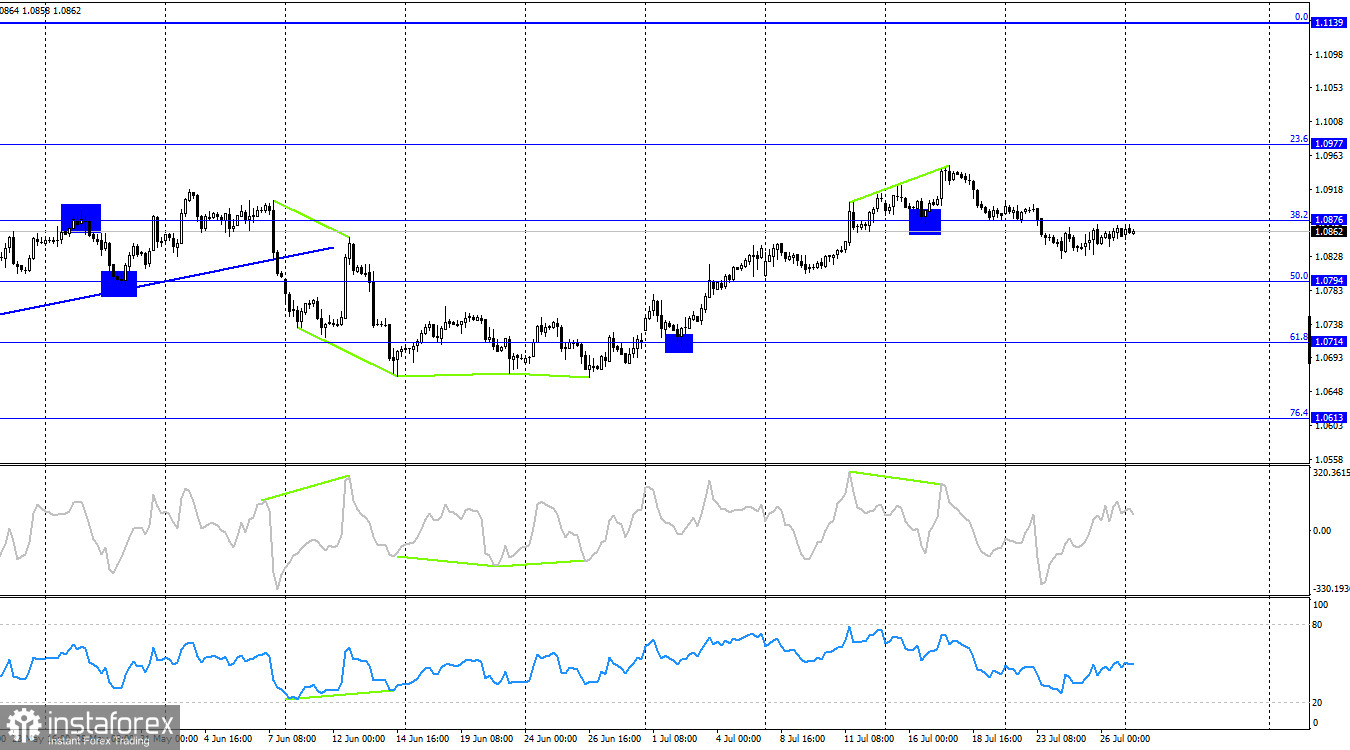
On the 4-hour chart, the pair turned in favor of the U.S. dollar and secured a position below the 38.2% correction level at 1.0876. Thus, the fall process may continue towards the 50.0% Fibonacci level at 1.0794. Emerging divergences are observed today in the CCI indicator – 'bearish.' The decline in quotations continues since the 'bearish' divergence was formed in the CCI indicator.
Commitments of Traders (COT) Report:
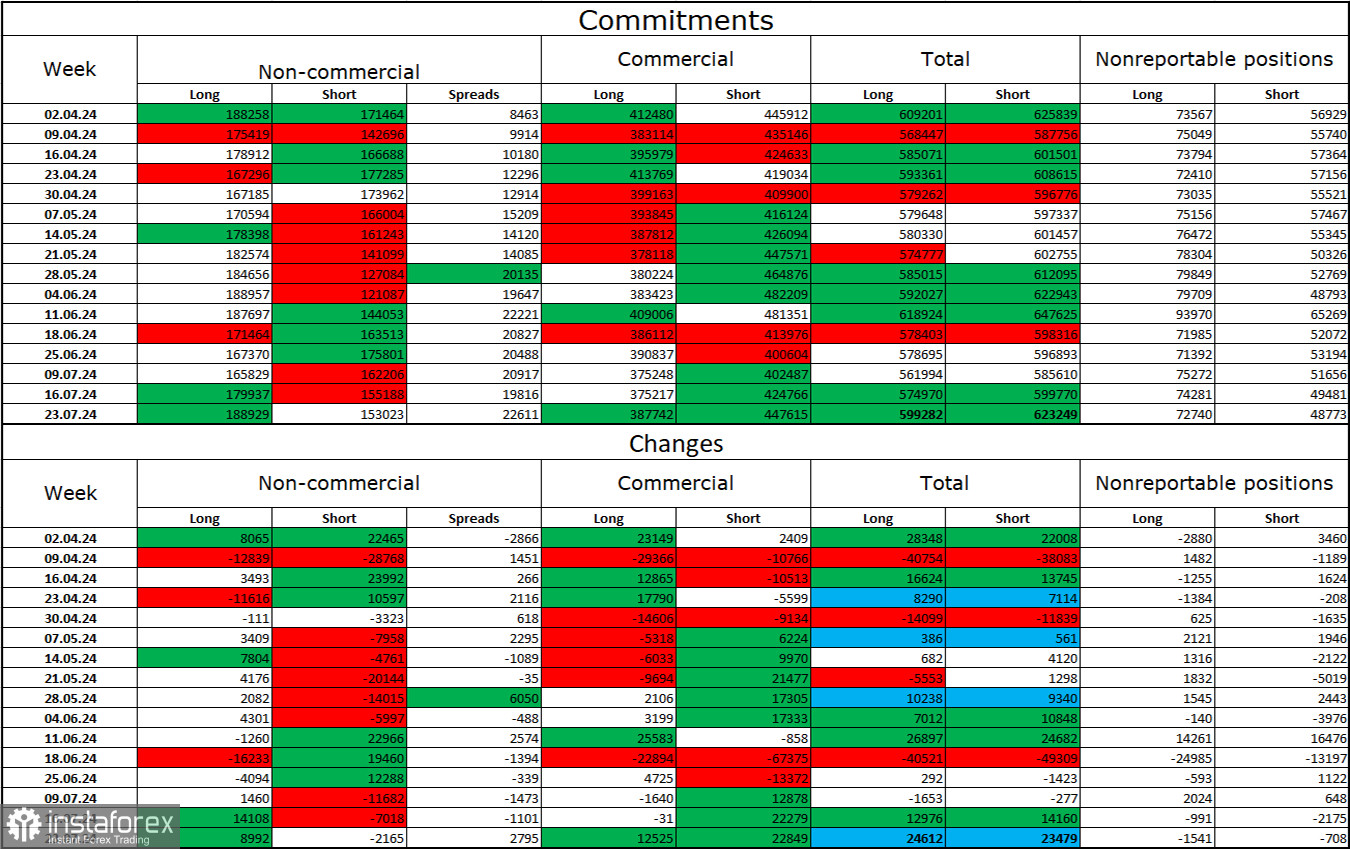
During the last reporting week, speculators opened 8,992 long positions and closed 2,165 short positions. The sentiment of the 'Non-commercial' group turned 'bearish' a couple of months ago, but currently, bulls are dominating again. The total number of long positions speculators hold now stands at 189 thousand, while short positions total 153 thousand.
I still believe that the situation will continue to shift in favor of the bears. I see no long-term reasons to buy the euro, as the ECB has started easing monetary policy, which will lower the yields of bank deposits and government bonds. In the US, these yields will remain high for several more months, making the dollar more attractive to investors. The potential for a decline in the European currency looks impressive, even according to the COT reports. However, one should remember graphical analysis, which currently does not allow for confident predictions of a strong decline in the euro.
News Calendar for the U.S. and Eurozone:
On July 29, the economic events calendar contains no entries. The influence of the information background on trader sentiment will be absent today.
Forecast for EUR/USD and Trading Tips:
Selling the pair was possible upon consolidation on the hourly chart below the level of 1.0917 with a target of 1.0858. This target has been achieved. New sell signals are needed and may form during the week. I would not consider buying in the coming days, as the bears have secured a position below the ascending corridor.
Fibonacci level grids are constructed at 1.0917–1.0668 on the hourly chart and at 1.0450–1.1139 on the 4-hour chart.