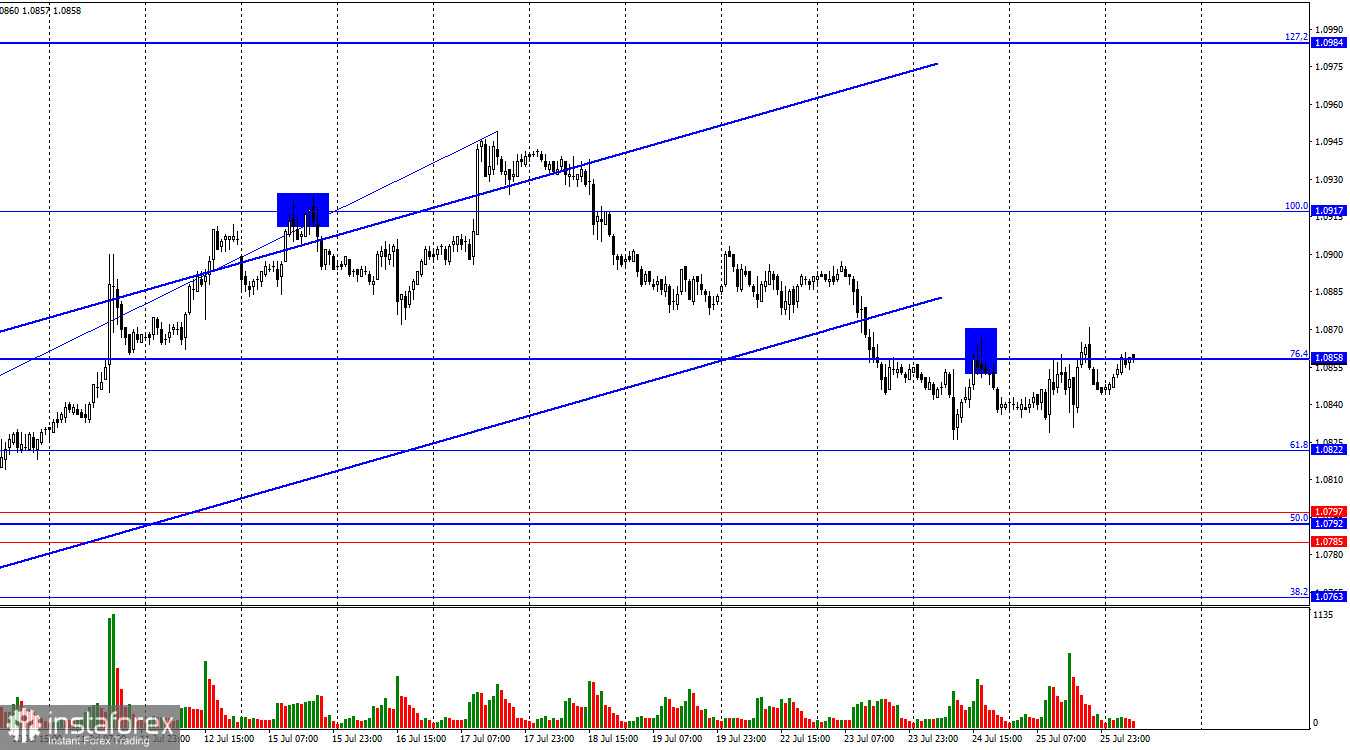
On Thursday, the EUR/USD pair returned to the 76.4% Fibonacci level at 1.0858, and on Friday, it made another return to this level. A rebound from 1.0858 would benefit the US dollar and resume the decline towards the 61.8% Fibonacci level at 1.0822. Consolidation of the pair above 1.0858 will increase the likelihood of continued growth towards the next corrective level at 1.0917.

The wave situation has become somewhat more complex but remains largely clear. The last upward wave broke the peak of the previous wave and can be considered complete. Thus, the bears have begun forming a corrective wave. To reverse the "bullish" trend, the bears need to break the low of the previous downward wave, around 1.0668. They need to go down another 180 points for this. Given current trader activity, this may take 2-3 weeks, one of which has already elapsed. A rapid decline is unlikely.
Thursday's information background supported both bulls and bears once more. The most interest among traders was in the US GDP and durable goods orders reports, which were released simultaneously yesterday. While the GDP report was significantly higher than even the most optimistic forecasts, the durable goods orders report was a complete failure. GDP grew by 2.8% quarter-over-quarter in the second quarter (preliminary estimate), while orders fell by 6.6% against expectations of +0.3%. Thus, it can be said that the GDP report could have strongly supported the dollar, but it was entirely overshadowed by the orders report. In my opinion, the GDP report is more significant, so I believe the bears missed a prime opportunity to enhance their position yesterday. Currently, the "bullish" trend remains, and all the bears' efforts are only enough for a corrective wave.

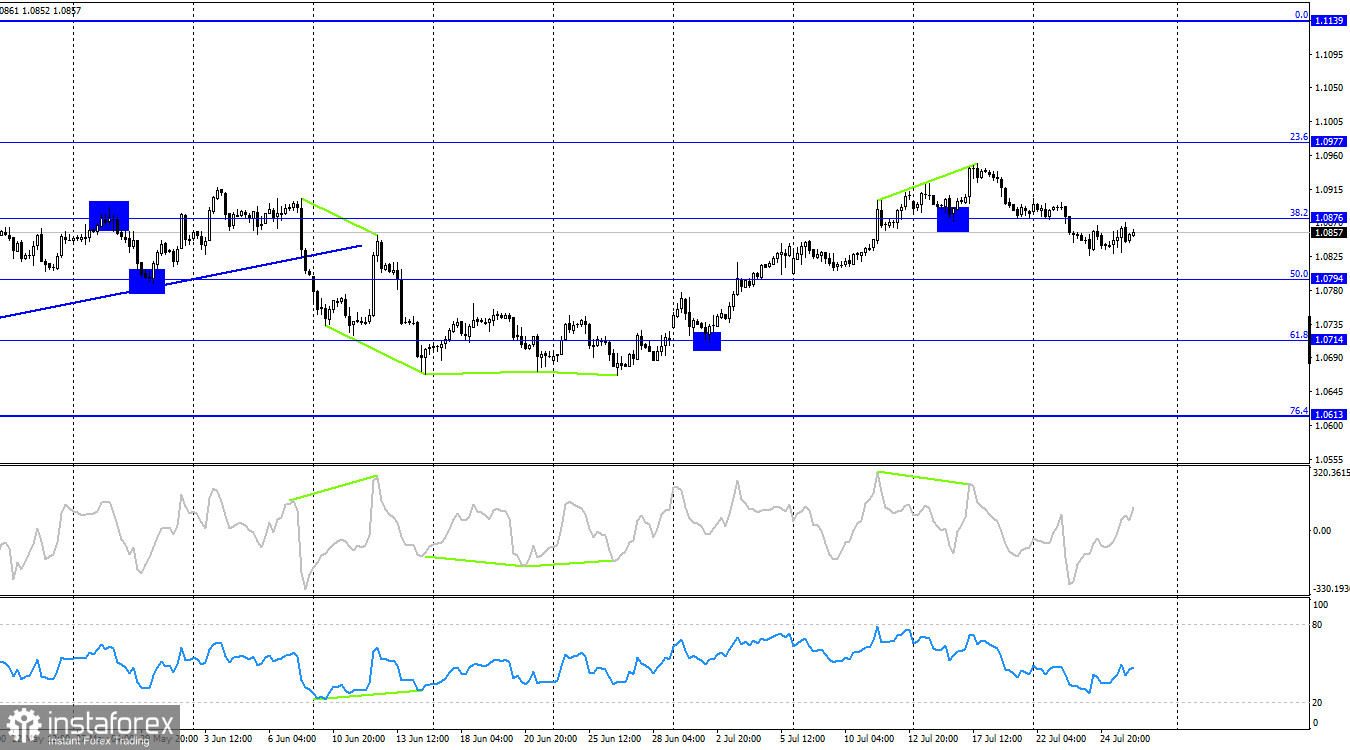
On the 4-hour chart, the pair reversed in favor of the US dollar and consolidated below the 38.2% corrective level at 1.0876. Thus, the decline may continue towards the 50.0% Fibonacci level at 1.0794. No emerging divergences are observed today in any indicator. The decline has continued since a "bearish" divergence was formed on the CCI indicator.
Commitments of Traders (COT) Report:

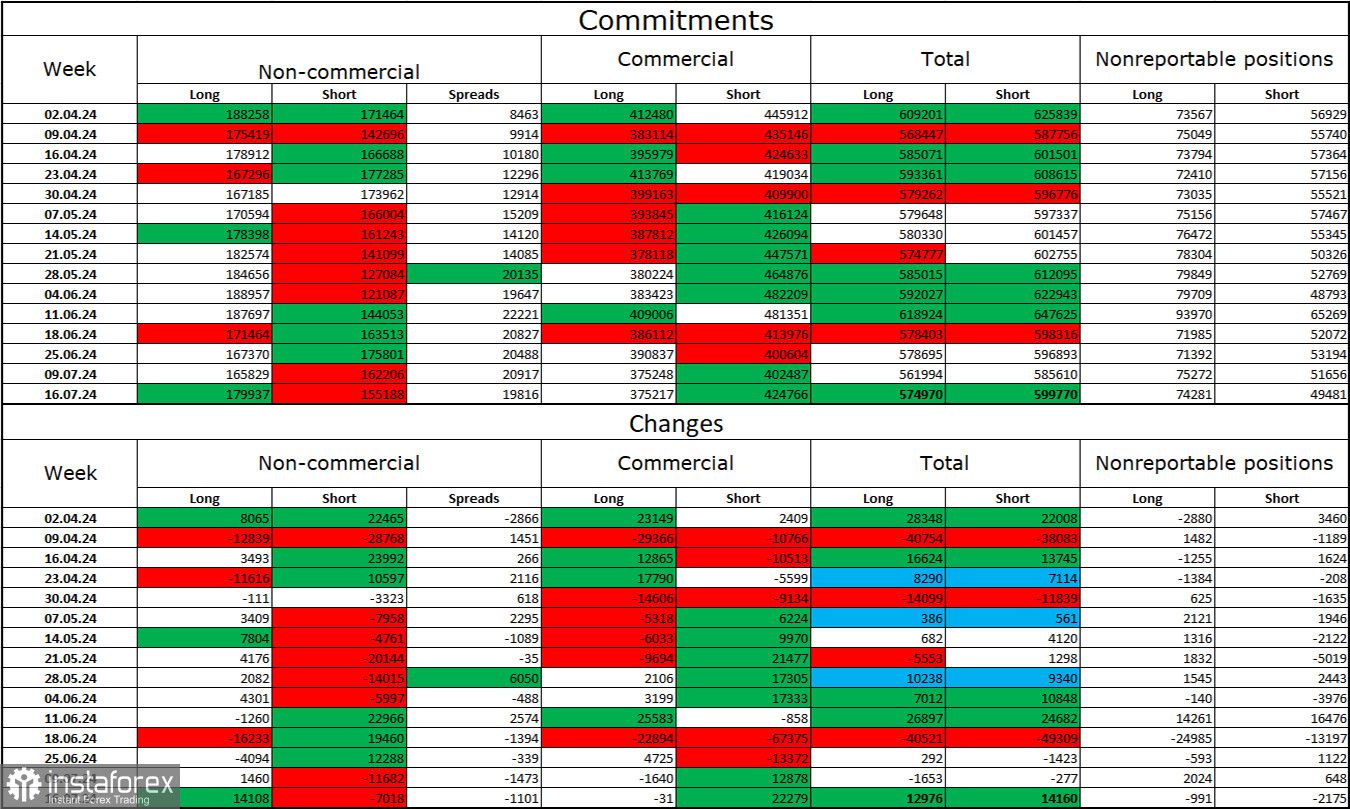
During the last reporting week, speculators opened 14,108 long positions and closed 7,018 short positions. The sentiment of the "Non-commercial" group changed to "bearish" several weeks ago, but currently, bulls are dominating again. The total number of long positions held by speculators is now 180,000, while short positions stand at 155,000.
I continue to believe that the situation will shift in favor of the bears. I see no long-term reasons to buy the euro, as the ECB has started easing monetary policy, which will lower the yields of bank deposits and government bonds. In the US, these yields will remain high for several more months, making the dollar more attractive to investors. The potential for the euro to decline is substantial even according to COT reports. However, one should not forget about the graphical analysis, which currently does not confidently suggest a strong decline in the euro.
News Calendar for the US and Eurozone:
US:
- Personal Consumption Expenditures (PCE) Price Index (12:30 UTC)
- Personal Income and Spending (12:30 UTC)
- University of Michigan Consumer Sentiment Index (14:00 UTC)
On July 26, the economic calendar includes three entries for the US. The influence of the information background on market sentiment today may be moderate, mainly in the second half of the day.
Forecast for EUR/USD and Trading Advice:
Selling the pair was possible upon consolidation below the 1.0917 level on the hourly chart, targeting 1.0858. Since the bears have managed to break through the 1.0858 level, sales can be maintained with targets at 1.0822 and 1.0785–1.0797 until the pair closes above 1.0858. I would not consider buying in the coming days, as the bears have consolidated below the upward trend channel.
Fibonacci grids are plotted at 1.0917–1.0668 on the hourly chart and 1.0450–1.1139 on the 4-hour chart.
 English
 Русский
 Bahasa Indonesia
 Bahasa Malay
 ไทย
ไทย Español
 Deutsch
 Български
 Français
 Tiếng Việt
 中文
中文 বাংলা
বাংলা हिन्दी
 Čeština
 Українська
 Română

