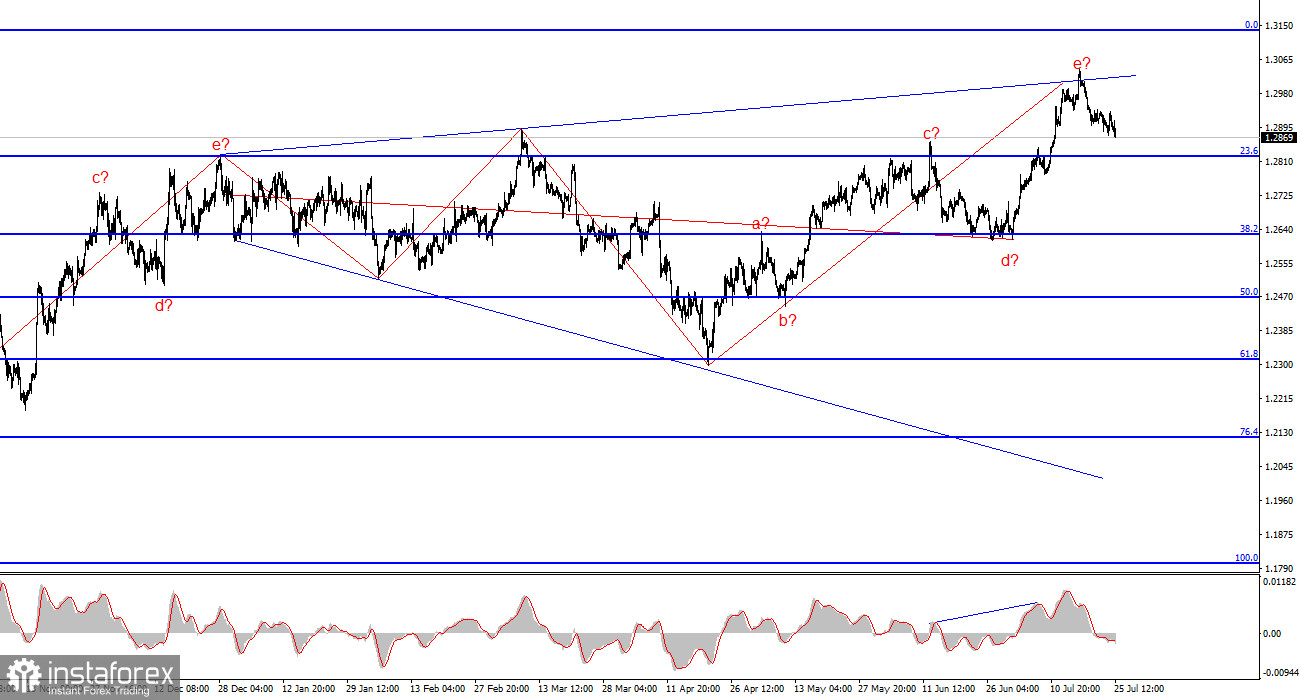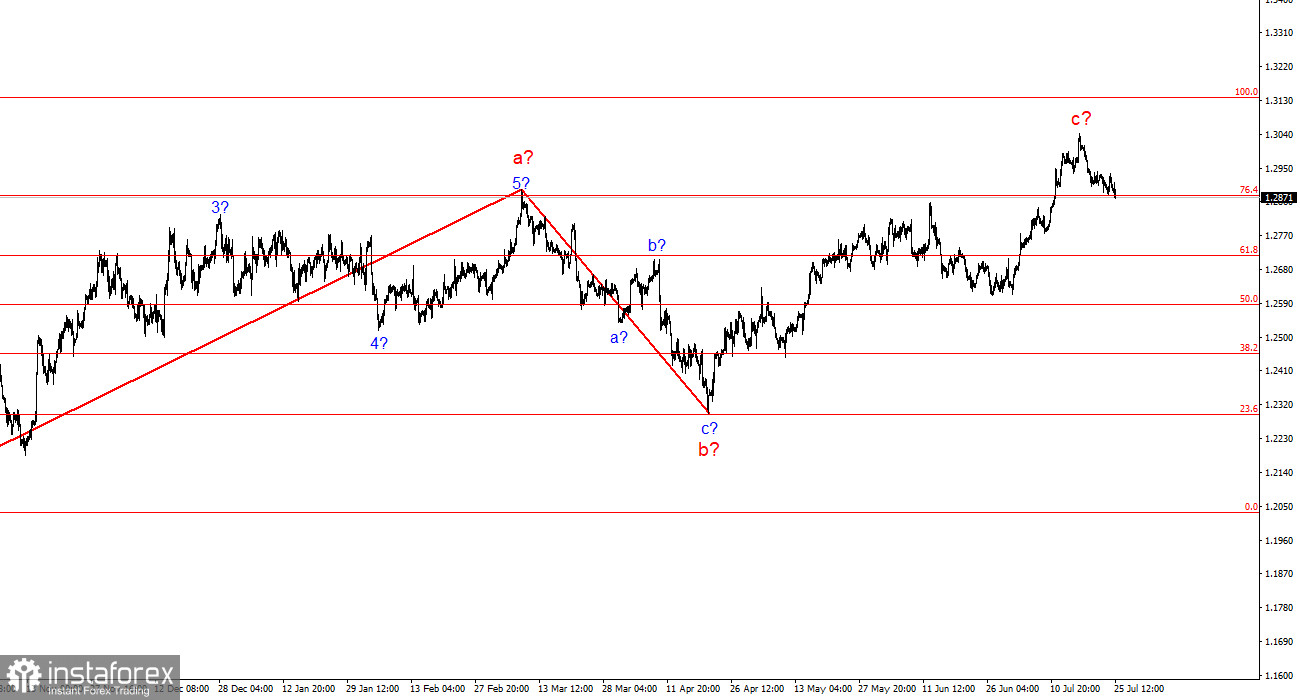
The wave pattern for the GBP/USD pair remains quite complex and ambiguous. For some time, the wave picture looked convincing and suggested a downward wave pattern with targets below the 23 level. However, in practice, demand for the US dollar grew too strong to implement this scenario.
Currently, the wave pattern has become completely unreadable. I use simple structures in my analysis, as complex ones have too many nuances and ambiguities. At present, we see an upward wave that has overlapped a downward wave, which in turn overlapped a previous upward wave, which overlapped an earlier downward wave. The only assumption that can be made is an expanding triangle with an upper point around the 30 level and a balancing line around the 26 level. Last week, the upper line of the triangle was reached, and the unsuccessful attempt to break through it indicates the market's readiness to build a downward wave pattern.
The British Pound is Ready to Continue Falling
The GBP/USD rate fell by 30 basis points on Thursday, but this might just be the beginning. The key point for me now is reaching the upper line of the expanding triangle and the completed external appearance of the five-wave upward structure. I believe these two factors suggest a potential decline in the pair at least to the 26 level, where the "balancing line" has been hovering for over six months. Based on this analysis, I build my near-term assumptions.
Today, a truly important and genuinely optimistic GDP report for the second quarter was released in the US. I wouldn't even call it "optimistic," as this term is more applicable to a negative trend where a strong value appears at the end. The American economy slowed down in the fourth and first quarters but still showed high growth rates. All this is against the backdrop of the Fed's ongoing strict "hawkish" policy. Therefore, I see no reason for the Fed to rush to lower the interest rate in September. The market has already adjusted the FOMC rate several times and played out this unrealistic event.
Given this, I believe the demand for the British pound will continue to decline. I am not considering any other scenario at the moment. Next week, a new Fed meeting will occur, after which we will likely learn that the regulator will not rush events. If the Nonfarm Payrolls and unemployment reports also show values above market expectations, the growth of the US currency may accelerate. This is the scenario I expect.
General Conclusions
The wave pattern for the GBP/USD pair still suggests a decline. If a new upward trend segment began on April 22, it has already taken on a five-wave appearance. Consequently, a three-wave correction should now be expected. The unsuccessful attempt to break through the upper line of the triangle indicates the market's readiness to build a downward wave pattern. Sales of the pair should be considered in the near future with targets around 1.2820 and 1.2627, which correspond to 23.6% and 38.2% Fibonacci levels.
On a higher wave scale, the wave pattern has transformed. We can now assume the construction of a complex and extended upward corrective structure. Currently, it is a three-wave structure, but it could transform into a five-wave structure, which may take several more months or even longer to complete.
Basic Principles of My Analysis:
- Wave structures should be simple and understandable. Complex structures are difficult to play out and often undergo changes.
- If there is no certainty about what is happening in the market, it is better not to enter.
- There is no 100% certainty in the direction of movement. Remember to use Stop Loss orders.
- Wave analysis can be combined with other types of analysis and trading strategies.
 English
 Русский
 Bahasa Indonesia
 Bahasa Malay
 ไทย
ไทย Español
 Deutsch
 Български
 Français
 Tiếng Việt
 中文
中文 বাংলা
বাংলা हिन्दी
 Čeština
 Українська
 Română


