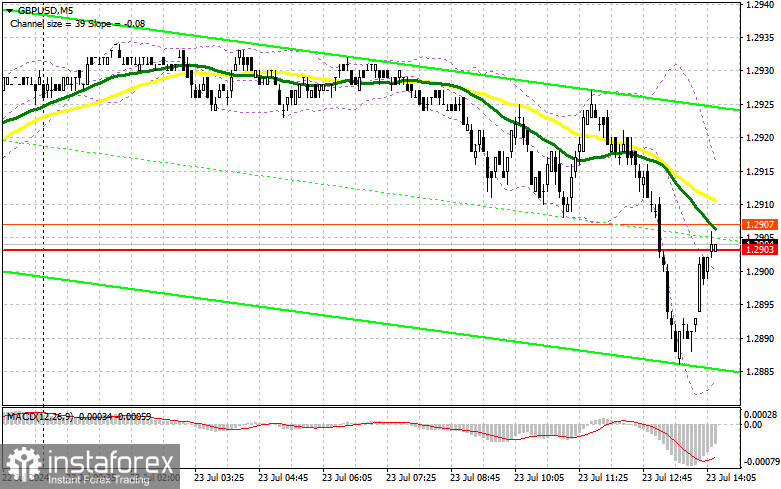
In my morning forecast, I focused on the 1.2903 level and planned to make trading decisions based on it. Let's look at the 5-minute chart and see what happened. The breakout of this level occurred quite quickly, so there was no false breakout. The technical outlook for the second half of the day has been revised.
To Open Long Positions on GBP/USD:
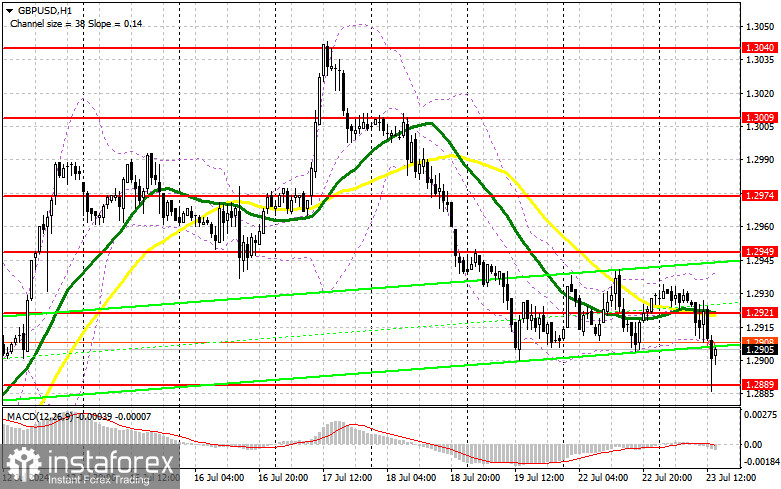
Now, we have a reference point for US economic data, unlike the complete absence of it in the first half of the day. We are expecting data on existing home sales, which may lead to another decline in the pound—provided the figures are better than economists' forecasts—and data on the Richmond Fed manufacturing index. In case of a decline in the pair, only a false breakout formation around the new support at 1.2889, formed from today's results, will provide an entry point for long positions to update the intermediate resistance at 1.2921, where the moving averages are passing, favoring sellers. A breakout and retest from top to bottom of this range will restore the pound's upward potential, leading to an entry point for long positions with the possibility of testing 1.2949. The furthest target will be the area of 1.2974, where I plan to take profits. If GBP/USD declines further and there is a lack of activity from bulls at 1.2889 in the second half of the day, the market will face rather grim prospects. This will also lead to a decline and update of the next support at 1.2855, marking the end of the recent bull market. A false breakout at that level will provide a suitable condition for opening long positions. I plan to buy GBP/USD on a rebound from the low of 1.2825 with the target of an upward correction of 30-35 points within the day.
To Open Short Positions on GBP/USD:
Sellers have shown themselves, but buyers have withstood the first attack with dignity. However, all is not lost for the bears. Strong US data and a defense of 1.2921 will create ideal conditions for opening short positions with the prospect of a decline towards the new support at 1.2889. A breakout and retest from bottom to top of this range will pressure buyers' positions, leading to stop orders being triggered and opening the way to 1.2855. The furthest target will be the area of 1.2825, where I will take profits. Testing this level will put an end to today's struggle between buyers and sellers. If GBP/USD rises and there is a lack of activity at 1.2921 in the second half of the day, buyers will get a chance to rise. In this case, I will postpone sales until a false breakout at the level of 1.2949. In the absence of a downward movement, I will sell GBP/USD on a rebound from 1.2974, but only expecting a downward correction of 30-35 points within the day.
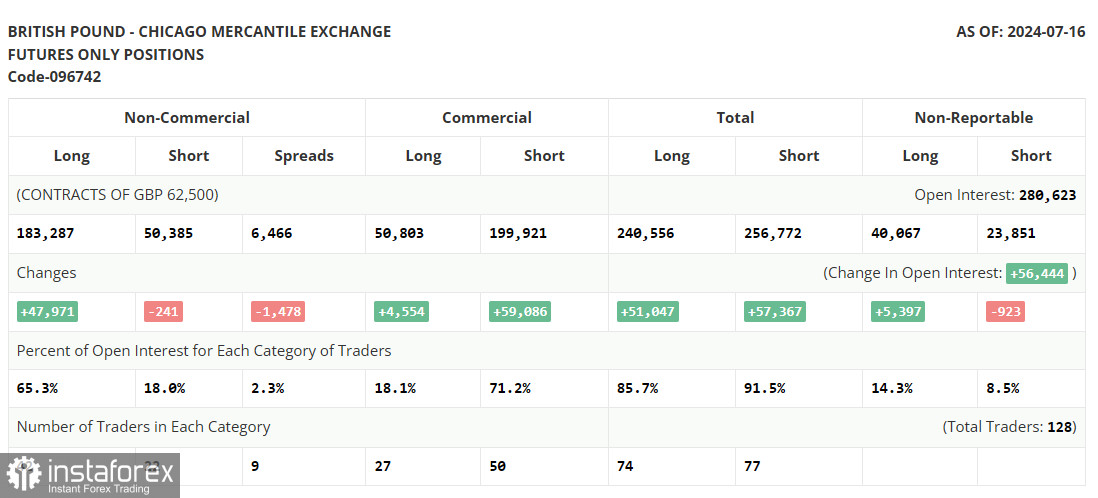
Commitment of Traders (COT) Report for July 16th:
The COT report observed an increase in long positions and a decrease in short positions. The Bank of England's decision to keep everything as it is allowed the pound to grow quite well—especially against the backdrop of expectations of a rate cut in the US. The change in political power also contributed to some growth in GBP/USD. However, the market is now entering a lull, which could lead, at best, to the pair hanging in a sideways channel, or we may see a further technical correction. But the lower the pound, the more attractive it will be for purchases. The latest COT report indicates that long non-commercial positions increased by 47,971 to 183,287, while short non-commercial positions fell by 241 to 50,385. As a result, the spread between long and short positions fell by 1,478.

Indicator Signals:
Moving Averages:
Trading is below the 30 and 50-day moving averages, indicating a possible continuation of the pair's decline. Note: The author considers the period and prices of the moving averages on the hourly chart (H1) and differs from the general definition of classical daily moving averages on the daily chart (D1).
Bollinger Bands:
In case of a decline, the lower boundary of the indicator around 1.2907 will act as support.
Indicator Descriptions:
- Moving Average: Determines the current trend by smoothing volatility and noise. Period – 50. Marked in yellow on the chart.
- Moving Average: Determines the current trend by smoothing volatility and noise. Period – 30. Marked in green on the chart.
- MACD (Moving Average Convergence/Divergence): Fast EMA – period 12. Slow EMA – period 26. SMA – period 9.
- Bollinger Bands: Period – 20.
- Non-commercial traders: Speculators such as individual traders, hedge funds, and large institutions using the futures market for speculative purposes and meeting certain requirements.
- Long non-commercial positions: Represent the total long open position of non-commercial traders.
- Short non-commercial positions: Represent the total short open position of non-commercial traders.
- Total non-commercial net position: The difference between the short and long positions of non-commercial traders.
 English
 Русский
 Bahasa Indonesia
 Bahasa Malay
 ไทย
ไทย Español
 Deutsch
 Български
 Français
 Tiếng Việt
 中文
中文 বাংলা
বাংলা हिन्दी
 Čeština
 Українська
 Română


