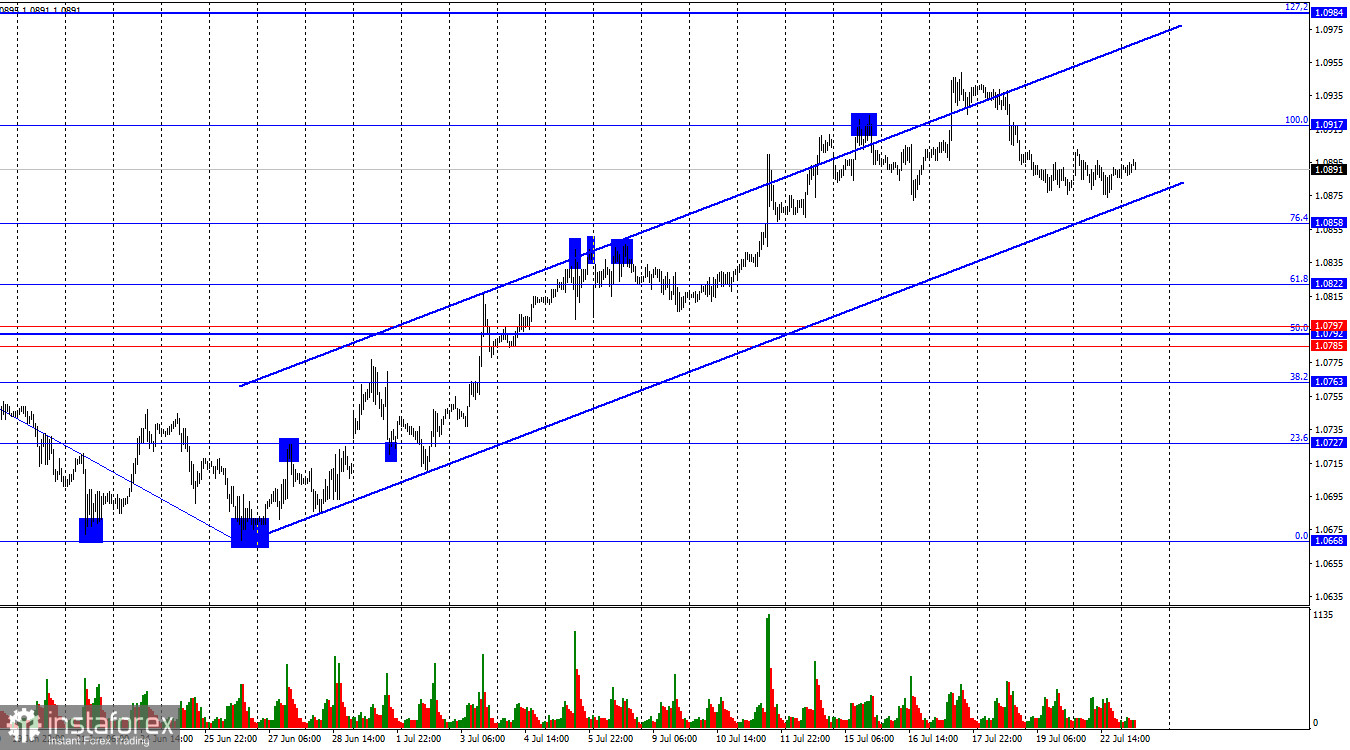
On Monday, the EUR/USD pair continued to decline after consolidating below the 100.0% corrective level at 1.0917 towards the 76.4% Fibonacci level at 1.0858 and the lower line of the upward trend channel, which continues to characterize the current market sentiment as "bullish." A rebound from this line or level will favor the euro and some growth towards 1.0917. Consolidation below the corridor will allow for the expectation of a "bearish" trend.

The wave situation has become more complicated. The last upward wave broke the peak of the previous wave and has yet to be completed, while the last downward wave failed to break the low of the previous wave. Thus, there are two signs of a trend change from "bearish" to "bullish." The informational background has supported only the bulls for several weeks now. Therefore, the bears have no opportunity to form a corrective wave. There is no sign of a trend change to "bearish" now.
The information background should have been present on Monday. Therefore, neither bulls nor bears had sufficient grounds for new market entries. Market activity will likely remain low today due to the absence of an information background. However, this week, the pair's fate for the near term should be decided. Consolidation below the channel will allow the bears to form at least a corrective wave. If not completely exhausted, the current "bullish" trend is on the brink. However, due to weak trader activity and weak movements, the trend can take a long time to change, and forming a new trend can also take a lot of time. The ECB's easing of monetary policy should support the bears, but graphical confirmations of this assumption are needed.

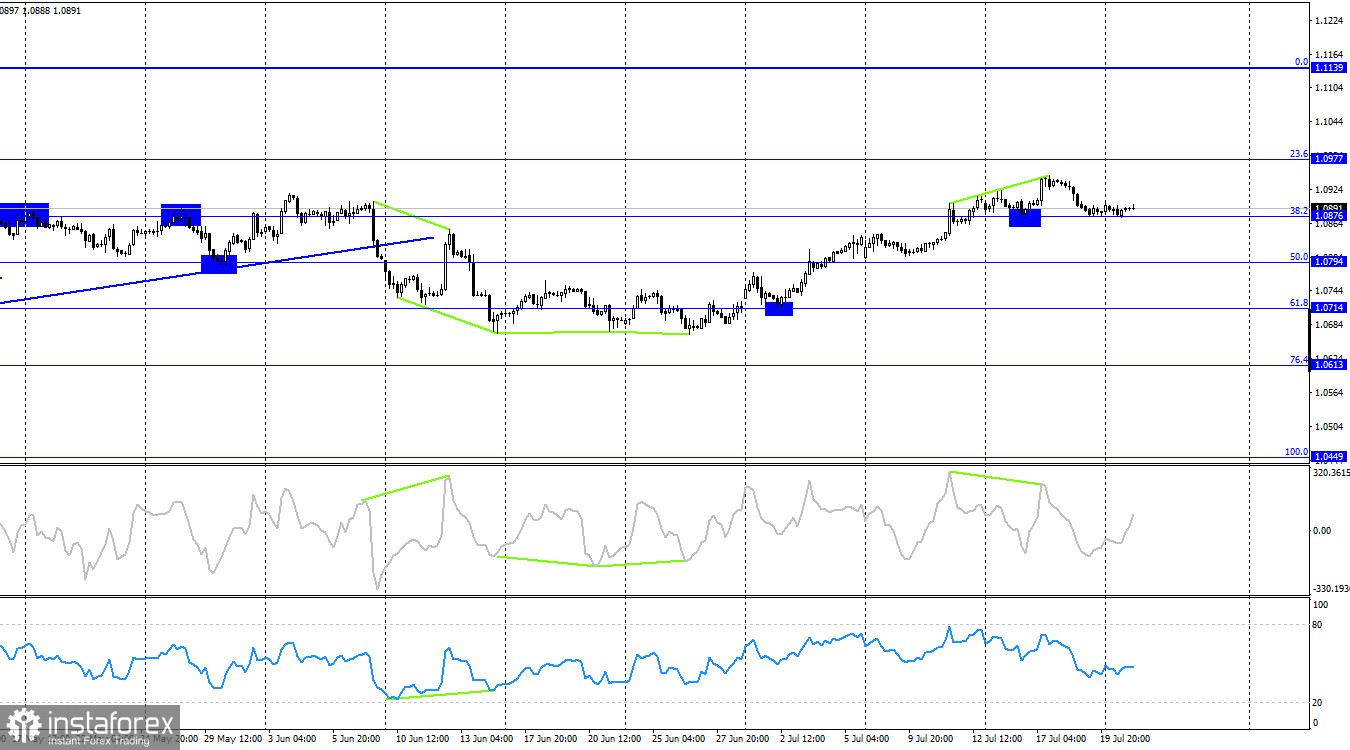
On the 4-hour chart, the pair consolidated above the 38.2% corrective level at 1.0876. Thus, the growth process can continue towards the next Fibonacci level of 23.6% at 1.0977. The CCI indicator has formed a "bearish" divergence, which allows the pair to start falling. However, it requires consolidation below the 1.0876 level to get a second sell signal. This signal would mean consolidation below the ascending corridor on the hourly chart.
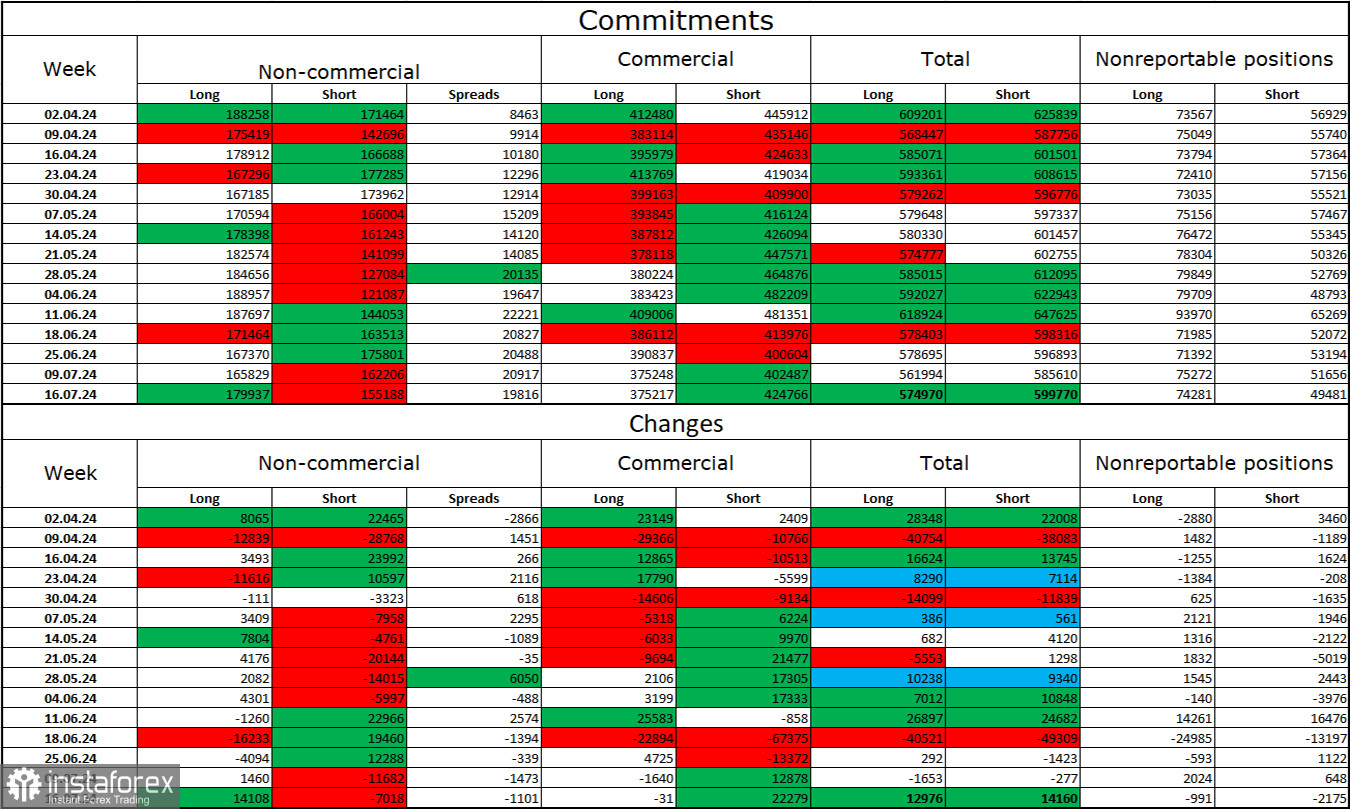
Commitments of Traders (COT) Report:

During the last reporting week, speculators opened 14,108 long positions and closed 7,018 short positions. The sentiment of the "Non-commercial" group changed to "bearish" a few weeks ago, but bulls are now dominating again. The total number of long positions speculators hold is now 180 thousand, and short positions – 155 thousand.
The situation will continue to change in favor of the bears. I do not see long-term reasons to buy euros, as the ECB has begun easing monetary policy, which will reduce the yield of bank deposits and government bonds. They will remain high for several months in America, making the dollar more attractive to investors. The potential for the euro's decline looks impressive, even according to the COT reports. However, we should remember graphical analysis, which does not allow us to speak confidently about a strong fall in the euro.
News Calendar for the USA and Eurozone:
- USA – Home Sales (14:00 UTC).
The economic events calendar for July 23rd contains only one insignificant entry. The influence of information background on trader sentiment today will be absent or very weak.
Forecast for EUR/USD and Trader Tips:
Selling the pair was possible when it consolidated on the hourly chart below the 1.0917 level with a target of 1.0858. These trades can now be kept open at least until the lower line of the channel is worked out. Purchases will become possible with a rebound from the 1.0858 level (or the lower line of the upward channel) on the hourly chart with a target of 1.0917.
Fibonacci levels are built from 1.0917 to 1.0668 on the hourly chart and from 1.0450 to 1.1139 on the 4-hour chart.
 English
 Русский
 Bahasa Indonesia
 Bahasa Malay
 ไทย
ไทย Español
 Deutsch
 Български
 Français
 Tiếng Việt
 中文
中文 বাংলা
বাংলা हिन्दी
 Čeština
 Українська
 Română

