Analysis of GBP/USD 5M

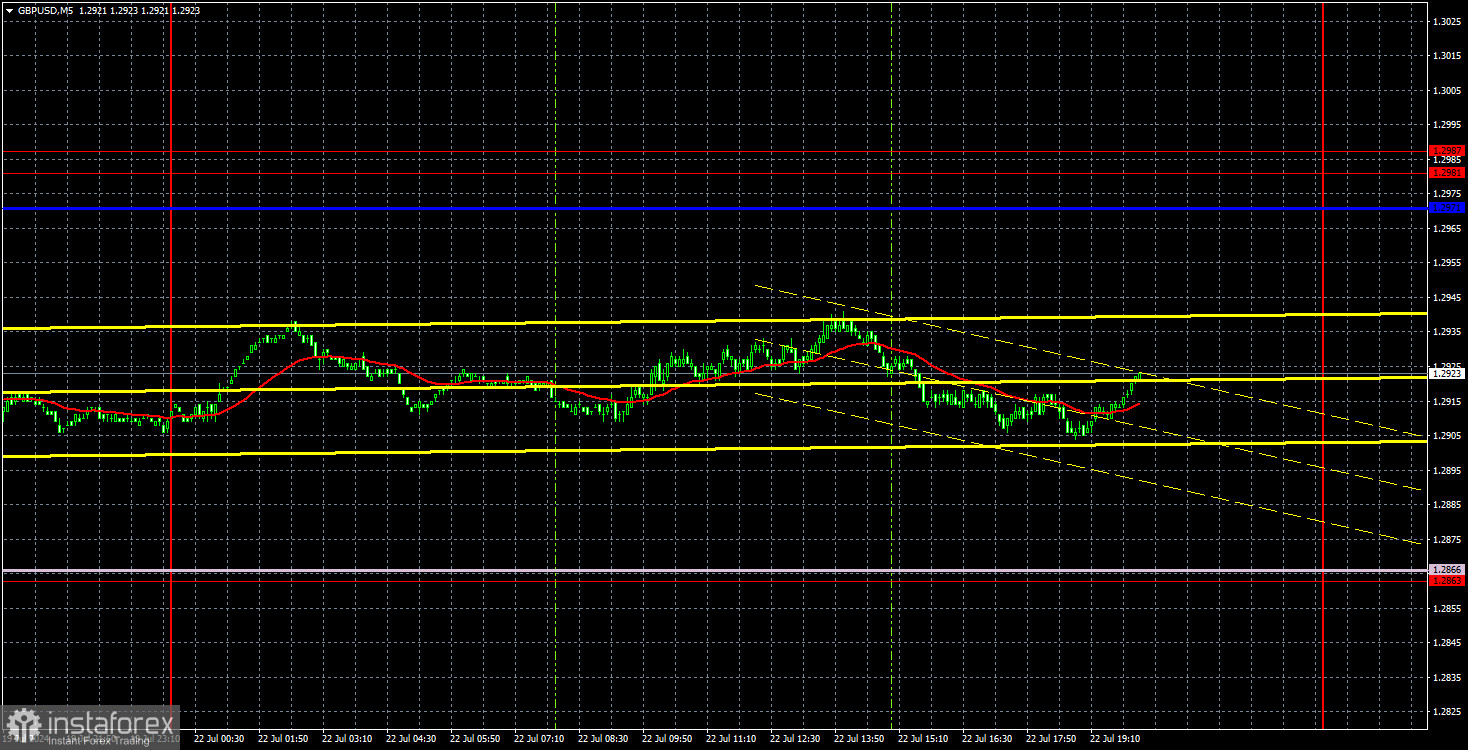
GBP/USD also traded with low volatility and failed to make a decisive move in either direction on Monday. Thus, there is little to analyze from yesterday. The price remained where it was on Friday evening. Since the price has settled below the ascending channel, we expect a more or less significant decline in the British currency. However, how many times in recent months have we seen a situation where the pound should fall, but instead, it turns idle and then starts to rise again? We would not be surprised if it follows a similar pattern again.
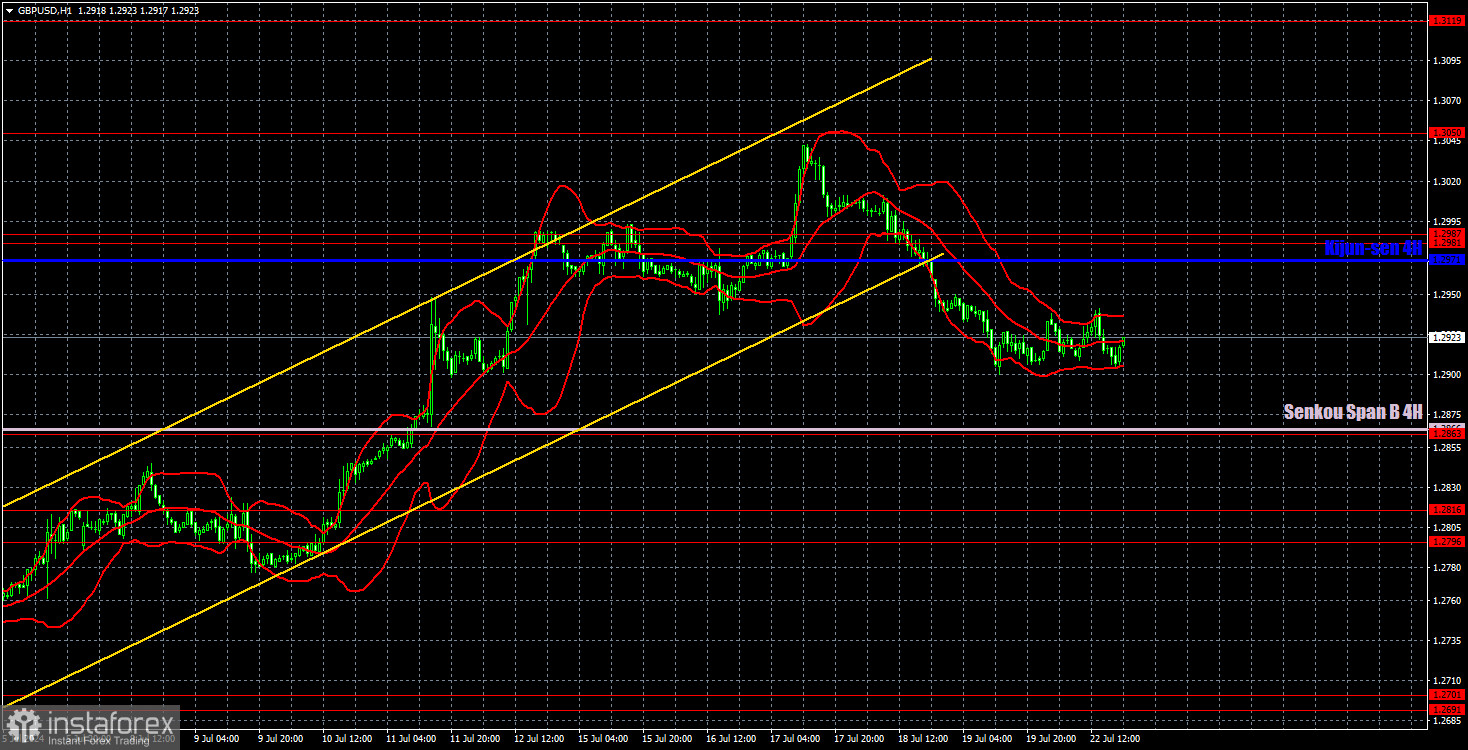
Globally, expecting anything other than a decline in the British currency remains extremely difficult. In the hourly time frame, GBP/USD has broken the uptrend. However, the pair needs to breach at least the Senkou Span B line to gain confidence in the pound's ability to decline. Yesterday, no reports were published in either the UK or the US, nor were there any speeches. There is nothing to analyze.
Throughout the day yesterday, no trading signals were generated, which is not surprising given the overall volatility of just 37 pips.
COT report:

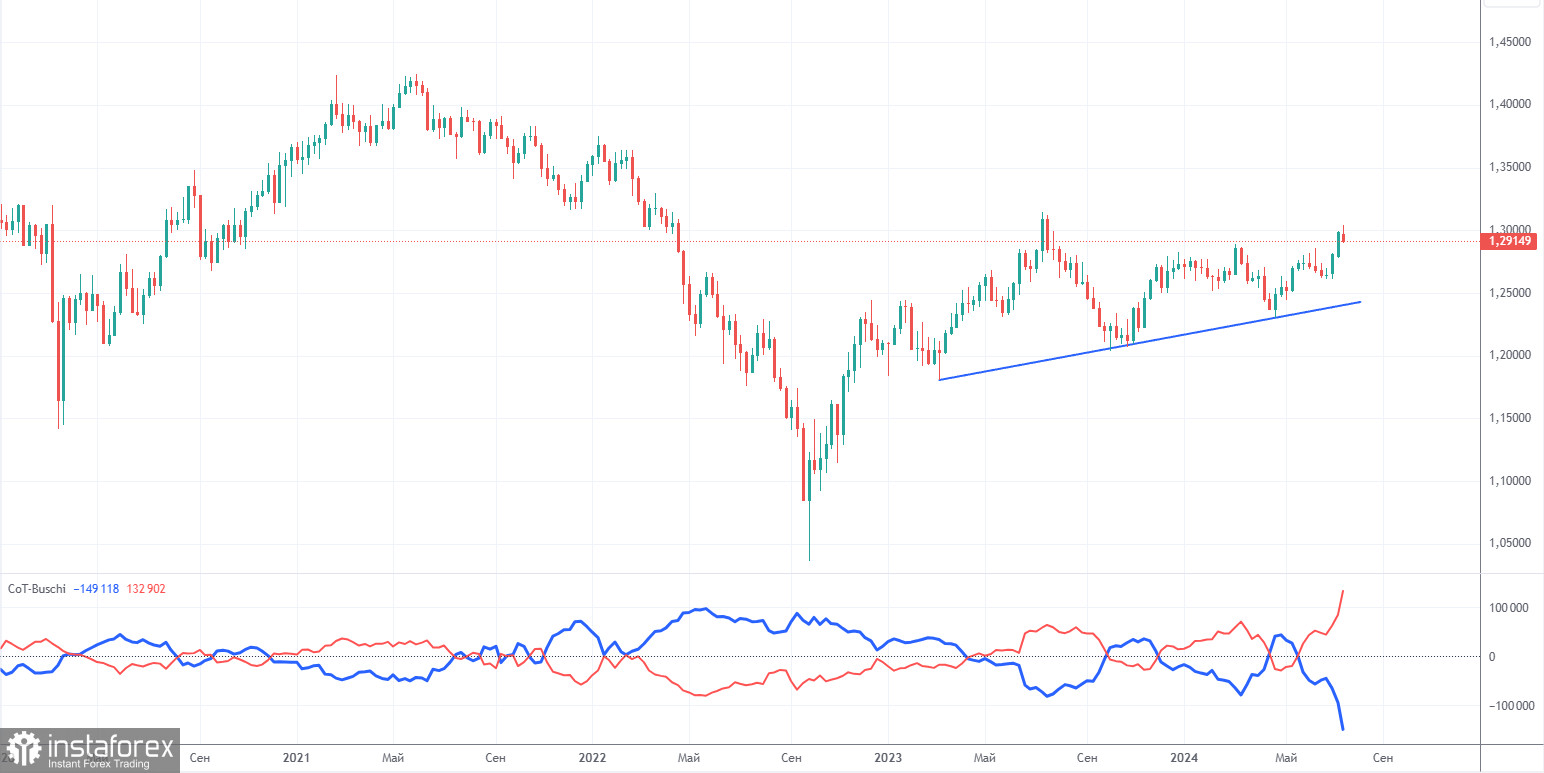
COT reports for the British pound indicate that the sentiment among commercial traders has been constantly shifting in recent years. The red and blue lines, representing the net positions of commercial and non-commercial traders, frequently cross each other and are often close to the zero mark. According to the latest report on the British pound, the non-commercial group opened 47,900 buy contracts and closed 200 short ones. As a result, the net position of non-commercial traders increased by 48,100 contracts over the week. Thus, sellers failed to seize the initiative once again.
The fundamental background still does not provide any grounds for long-term purchases of the pound sterling, and the currency has a chance to resume the global downward trend. However, the pair has an ascending trend line in the 24-hour timeframe. Therefore, unless the price breaches this trend line, a long-term decline in the pound is not expected. The pound is rising despite almost everything, but even the COT reports show that major players are buying it enthusiastically.
The non-commercial group currently holds 183,300 buy contracts and 50,400 sell contracts. The bulls are taking the lead in the market, but apart from the COT reports, there is no other indication of potential growth for the GBP/USD pair. Such a substantial advantage for buyers suggests a possible trend reversal.
Analysis of GBP/USD 1H

On the 1H chart, GBP/USD can end the current local uptrend and begin the long-awaited decline. We anticipate that the British currency's decline may be mild and short-lived. However, the decline remains the only logical and expected scenario. The current technical picture allows for a drop, at least to the Senkou Span B line, at 1.2866.
For July 23, we highlight the following important levels: 1.2215, 1.2269, 1.2349, 1.2429-1.2445, 1.2516, 1.2605-1.2620, 1.2691-1.2701, 1.2796-1.2816, 1.2863, and 1.2981-1.2987. The Senkou Span B (1.2866) and Kijun-sen (1.2971) lines can also serve as sources of signals. Setting the Stop Loss to breakeven when the price moves in the intended direction by 20 pips is recommended. The Ichimoku indicator lines may shift during the day, which should be considered when determining trading signals.
There are no significant events or reports scheduled in the UK or the US on Tuesday. Therefore, the pair might continue to drift downward or remain stagnant. Volatility will likely remain very low.
Description of the chart:
Support and resistance levels are thick red lines near which the trend may end. They do not provide trading signals.
The Kijun-sen and Senkou Span B lines are the lines of the Ichimoku indicator, plotted to the 1H timeframe from the 4H one. They are strong lines.
Extreme levels are thin red lines from which the price bounced earlier. They provide trading signals.
Yellow lines are trend lines, trend channels, and any other technical patterns.
Indicator 1 on the COT charts is the net position size for each category of traders.
 English
 Русский
 Bahasa Indonesia
 Bahasa Malay
 ไทย
ไทย Español
 Deutsch
 Български
 Français
 Tiếng Việt
 中文
中文 বাংলা
বাংলা हिन्दी
 Čeština
 Українська
 Română

