 English
  Русский
 Bahasa Indonesia
 Bahasa Malay
 ไทย
ไทย Español
 Deutsch
 Български
 Français
 Tiếng Việt
 中文
中文 বাংলা
বাংলা हिन्दी
 Čeština
 Українська
 Română

Trend Analysis (Fig. 1)
Today, GBP/USD may start moving upward from the 1.2908 level (the close of Friday's daily candle) with a target of 1.2941 – the 23.6% retracement level (red dotted line). The price will likely rise from this level with a target of 1.2980 – the 14.6% retracement level (red dotted line).
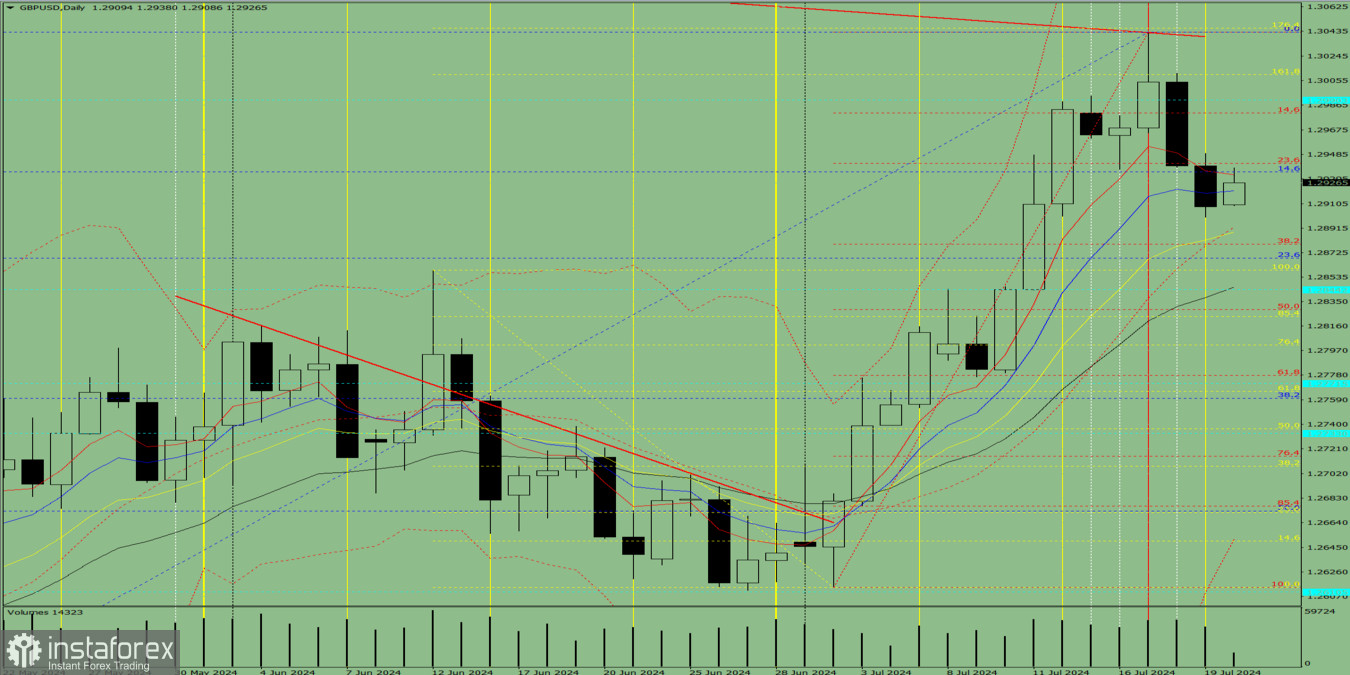
Fig. 1 (daily chart)
Comprehensive Analysis:
- Indicator Analysis – Up;
- Fibonacci Levels – Up;
- Volumes – Up;
- Candlestick Analysis – Down;
- Trend Analysis – Up;
- Bollinger Bands – Up;
- Weekly Chart – Up.
General Conclusion:
Today, GBP/USD may start moving upward from the 1.2908 level (the close of Friday's daily candle) with a target of 1.2941 – the 23.6% retracement level (red dotted line). The price will likely rise from this level with a target of 1.2980 – the 14.6% retracement level (red dotted line).
Alternative Scenario: The pair may attempt to continue the downward movement from the level of 1.2908 (the close of Friday's daily candle) with a target of 1.2820 – the 8 EMA (blue thin line). The price will likely rise from this line with a target of 1.2980 – the 14.6% retracement level (blue dotted line).