 English
  Русский
 Bahasa Indonesia
 Bahasa Malay
 ไทย
ไทย Español
 Deutsch
 Български
 Français
 Tiếng Việt
 中文
中文 বাংলা
বাংলা हिन्दी
 Čeština
 Українська
 Română

Analysis of macroeconomic reports:
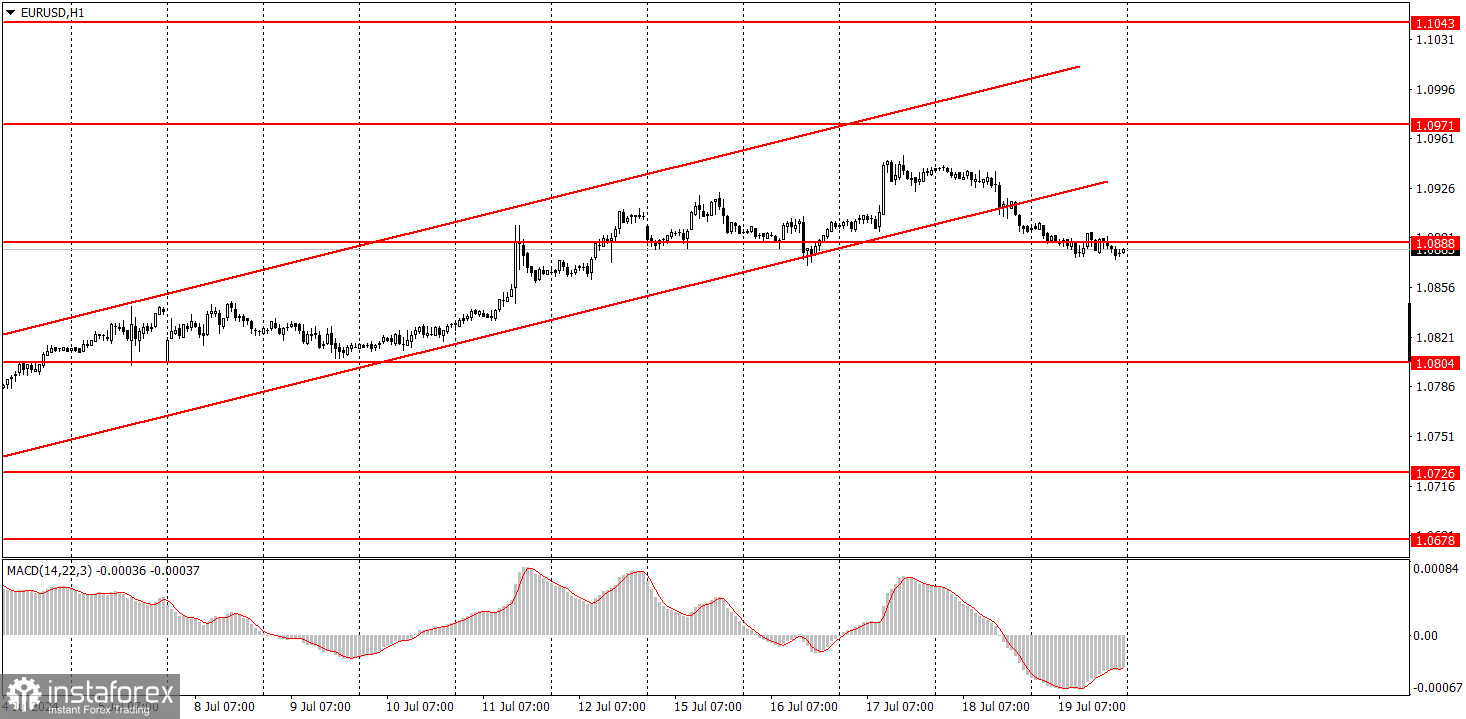
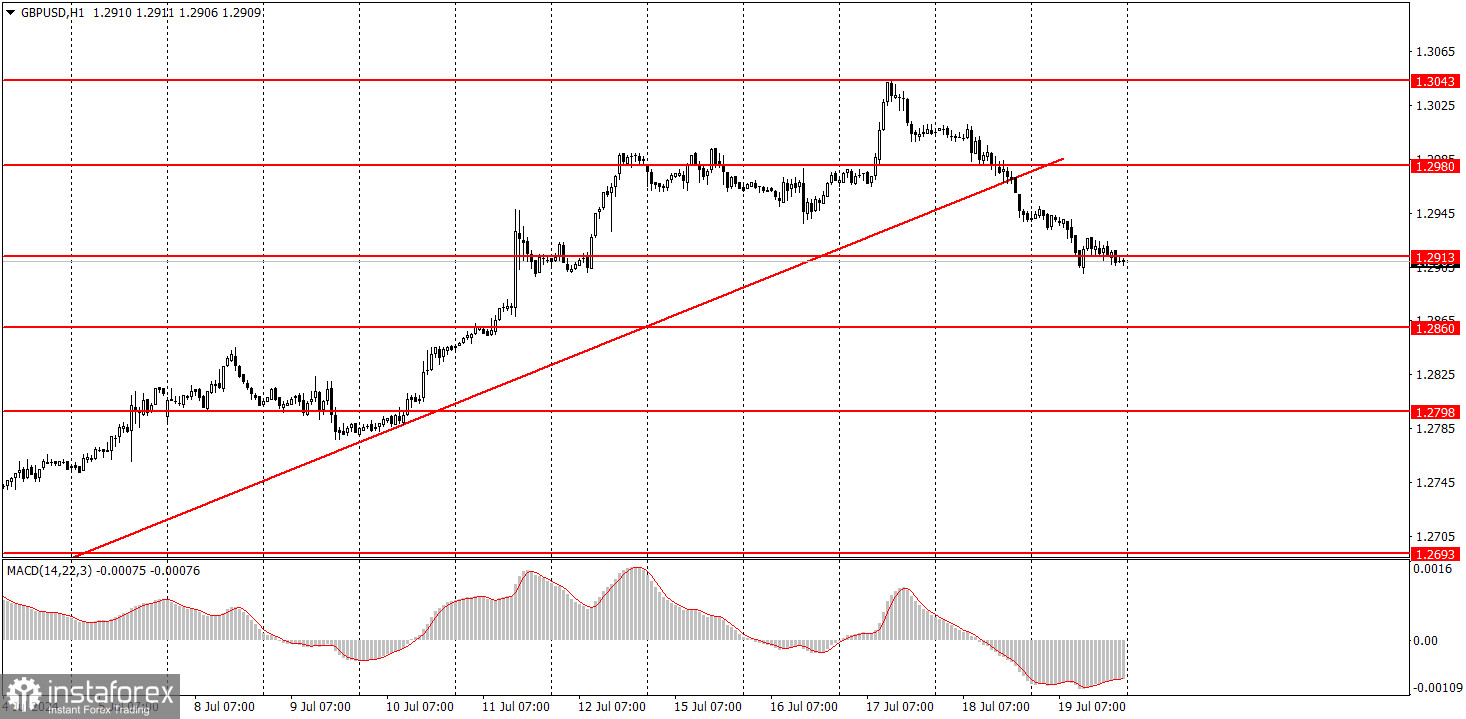
There are no macroeconomic events scheduled for Monday. Friday demonstrated how the EUR/USD pair can move without news releases. Thus, there will likely be no significant movements on Monday either. Nevertheless, over the next two to three weeks, both currency pairs may gradually fall, as the upward trend has been broken for both the pound and the euro from a technical standpoint.
Analysis of fundamental events:
There is absolutely nothing noteworthy among the fundamental events. Everything points to another "boring Monday" ahead. In our opinion, the euro and the pound remain incredibly overbought, so a decline will be both logical and inevitable.
General conclusions:
There is nothing to highlight during the first trading day; market participants will trade both currency pairs based solely on technical factors. However, technical factors alone are unlikely to push the price even 40 pips. We will likely see a flat or a remote decline in both currency pairs again. Unless some events occur over the weekend that must be addressed on Monday. Recall that each Monday opened with a gap in the past three weeks. This was influenced twice by elections in France and once by an assassination attempt on Donald Trump's life.
Basic rules of a trading system:
1) The strength of a signal is determined by the time it took for the signal to form (bounce or level breakthrough). The shorter the time required, the stronger the signal.
2) If two or more trades around a certain level are initiated based on false signals, subsequent signals from that level should be ignored.
3) In a flat market, any currency pair can produce multiple false signals or none at all. In any case, it's better to stop trading at the first signs of a flat market.
4) Trades should be opened between the start of the European session and mid-way through the U.S. session. All trades must be closed manually after this period.
5) In the hourly time frame, trades based on MACD signals are only advisable amidst substantial volatility and an established trend, confirmed either by a trendline or trend channel.
6) If two levels are too close to each other (from 5 to 20 pips), they should be considered as a support or resistance zone.
7) After moving 15 pips in the intended direction, the Stop Loss should be set to break-even.
What the charts show:
Support and Resistance price levels can serve as targets when buying or selling. You can place Take Profit levels near them.
Red lines represent channels or trend lines that depict the current trend and indicate the preferred trading direction.
The MACD (14,22,3) indicator, encompassing both the histogram and signal line, acts as an auxiliary tool and can also be used as a source of signals.
Important speeches and reports (always noted in the news calendar) can profoundly influence the price dynamics. Hence, trading during their release calls for heightened caution. It may be reasonable to exit the market to prevent abrupt price reversals against the prevailing trend.
Beginners should always remember that not every trade will yield profit. Establishing a clear strategy, coupled with effective money management, is key to long-term success in trading.