 English
  Русский
 Bahasa Indonesia
 Bahasa Malay
 ไทย
ไทย Español
 Deutsch
 Български
 Français
 Tiếng Việt
 中文
中文 বাংলা
বাংলা हिन्दी
 Čeština
 Українська
 Română

Trend Analysis (Fig. 1)
Today, EUR/USD may continue to fall from the level of 1.0895 (yesterday's daily candle close), aiming for 1.0881 – the 23.6% retracement level (red dashed line). Upon testing this level, the price may rise, with 1.0948 – the upper fractal (blue dashed line) as the target.
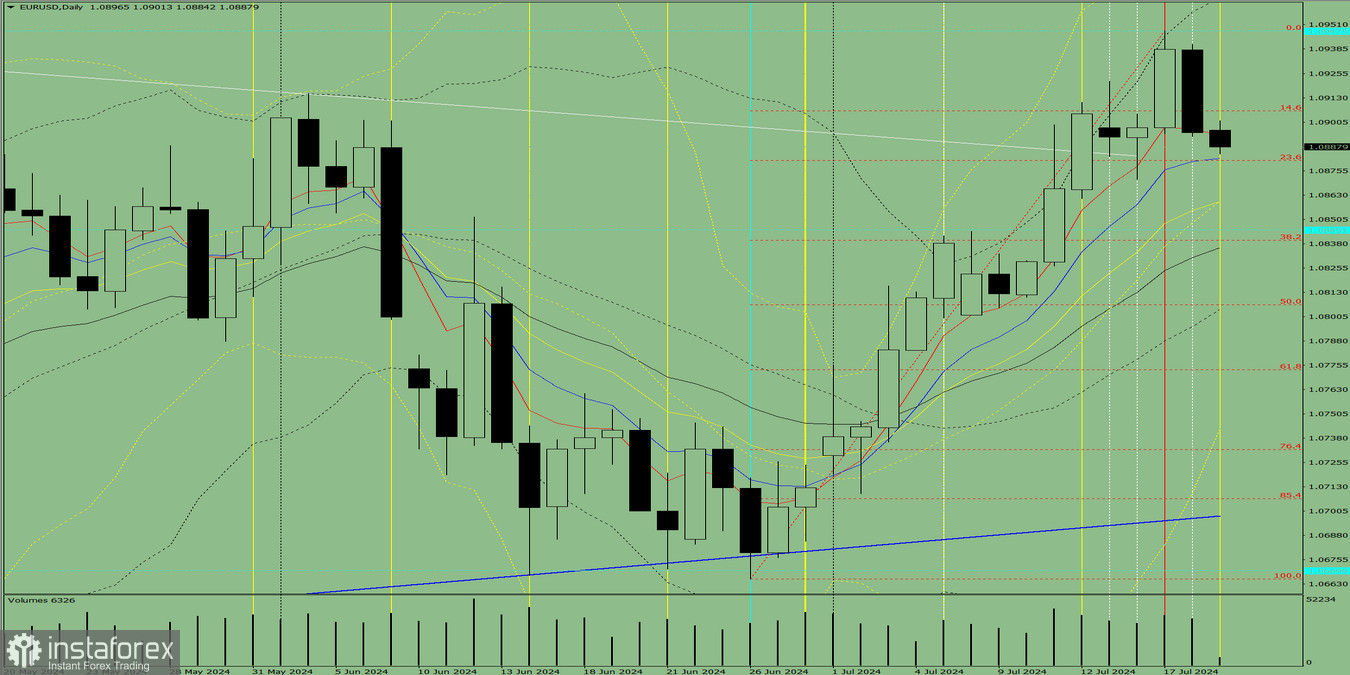
Fig. 1 (daily chart)
Comprehensive Analysis:
- Indicator Analysis – down;
- Fibonacci Levels – down;
- Candlestick Analysis – down;
- Trend Analysis – up;
- Bollinger Bands – up;
- Weekly Chart – up.
General Conclusion:
Today, the price may continue to fall from the level of 1.0895 (yesterday's daily candle close), as it aims for 1.0881 – the 23.6% retracement level (red dashed line). Upon testing this level, an upward movement is possible with the target of 1.0948 – the upper fractal (blue dashed line).
Alternative Scenario: Today, the price may continue to fall from the level of 1.0895 (yesterday's daily candle close), as it aims for 1.0860 – the 13 EMA (thin yellow line). Upon testing this line, an upward movement is possible with the target of 1.0948 – the upper fractal (blue dashed line).