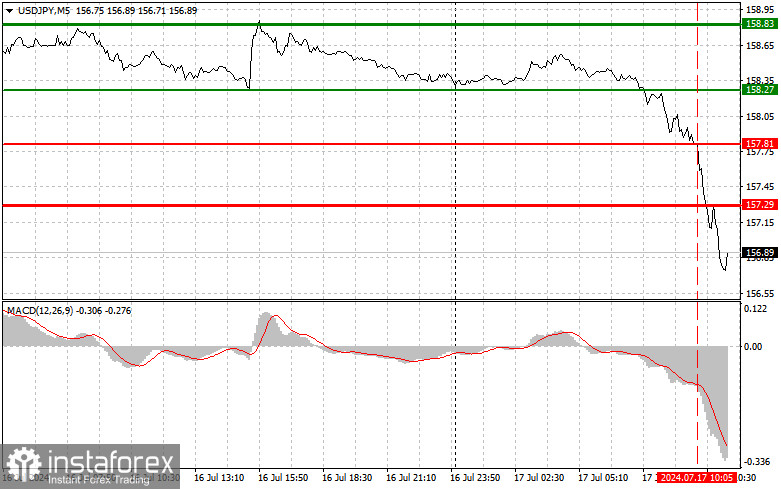
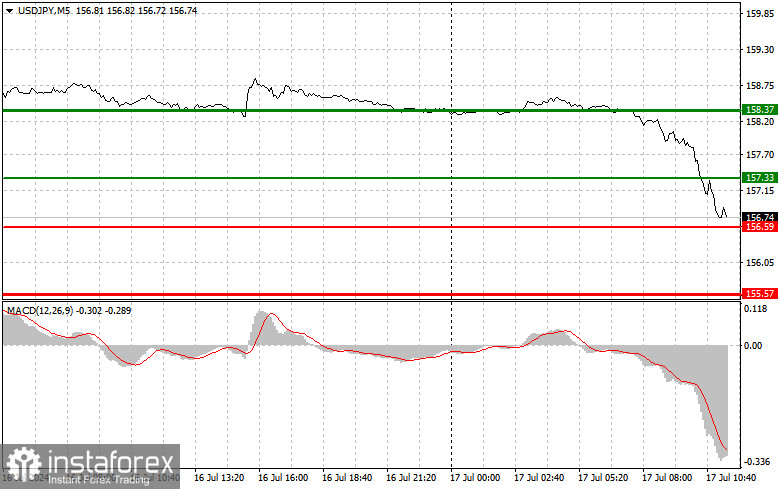
Analysis of Trades and Trading Tips for the Japanese YenThe US dollar continued to quickly lose its position against the Japanese yen. The test of the 157.81 price occurred when the MACD indicator had moved significantly down from the zero mark, which limited the pair's downward potential. For this reason, I did not sell. Unfortunately, I also couldn't wait for the implementation of scenario No. 2 to buy, as the pair continued to decline actively. The difference in central bank interest rates may become less significant in the near future, which is the main factor putting pressure on the dollar. Ahead are figures on the number of building permits issued, the number of new housing starts, and changes in industrial production volumes in the US. Speeches by FOMC members Thomas Barkin and Christopher Waller, who may support the idea of rate cuts, could also provoke new dollar sales. As for the intraday strategy, I plan to act based on the implementation of scenarios No. 1 and No. 2.

Buy signalScenario No. 1: I plan to buy USD/JPY today when I reach the entry point in the area of 157.33 (green line on the chart) in order to grow to the level of 158.37 (thicker green line on the chart). Around 158.37, I will exit the purchases and open sales in the opposite direction (expecting a movement of 30-35 points in the opposite direction from the level). It is unlikely to count on a strong growth of the pair today. Important! Before buying, make sure the MACD indicator is above the zero mark and just starting to rise from it.Scenario No. 2: I also plan to buy USD/JPY today in case of two consecutive tests of the 156.59 price when the MACD indicator is in the oversold area. This will limit the pair's downward potential and lead to a market reversal upward. Growth to the opposite levels of 157.33 and 158.37 can be expected.Sell SignalScenario No. 1: I plan to sell USD/JPY today after the 156.59 level (red line on the chart) is updated, which will lead to a quick decline in the pair. The key target for sellers will be the 155.57 level, where I will exit the sales and immediately open purchases in the opposite direction (expecting a movement of 20-25 points in the opposite direction from the level). Pressure on the pair will remain, and weak US statistics will lead to another update of the daily low. Important! Before selling, make sure the MACD indicator is below the zero mark and just starting to fall from it.Scenario No. 2: I also plan to sell USD/JPY today in case of two consecutive tests of the 157.33 price when the MACD indicator is in the overbought area. This will limit the pair's upward potential and lead to a market reversal downward. A decline to the opposite levels of 156.59 and 155.57 can be expected.

What's on the Chart:
- Thin green line: the entry price at which you can buy the trading instrument.
- Thick green line: the approximate price where you can set Take Profit or manually lock in profits since further growth above this level is unlikely.
- Thin red line: the entry price at which you can sell the trading instrument.
- Thick red line: the approximate price where you can set Take Profit or manually lock in profits since further decline below this level is unlikely.
- MACD indicator. When entering the market, it is important to be guided by overbought and oversold zones.
Important. Novice traders in the forex market need to make decisions about entering the market very carefully. Before the release of important fundamental reports, it is best to stay out of the market to avoid falling into sharp fluctuations in the exchange rate. If you decide to trade during news releases, always set stop orders to minimize losses. Without stop orders, you can quickly lose your entire deposit, especially if you do not use money management and trade in large volumes.Remember that successful trading requires a clear trading plan, like the one presented above. Spontaneous trading decisions based on the current market situation are inherently a losing strategy for an intraday trader.
*The market analysis posted here is meant to increase your awareness, but not to give instructions to make a trade


 English
 Русский
 Bahasa Indonesia
 Bahasa Malay
 ไทย
ไทย Español
 Deutsch
 Български
 Français
 Tiếng Việt
 中文
中文 বাংলা
বাংলা हिन्दी
 Čeština
 Українська
 Română

