Analysis of EUR/USD 5M

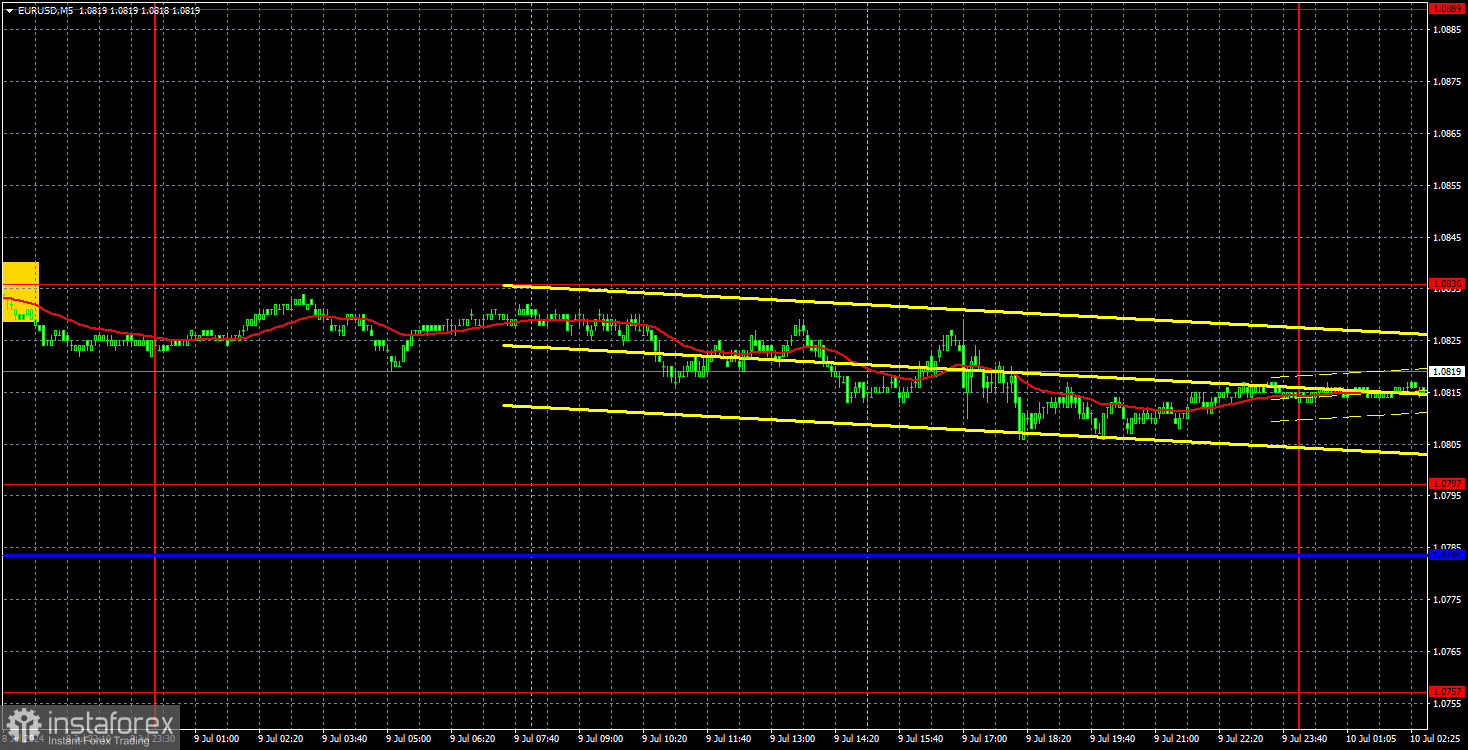
EUR/USD has been going through low volatility. There were no economic reports in either the US or the Eurozone, but no one could call Federal Reserve Chief Jerome Powell's speech in the U.S. Congress a "secondary event." In fact, Powell gave little away. He simply repeated what the market has long known, but this time directly to the congressmen. His speech was published on the Fed's website several hours before the actual speech in Congress. As we can see from the technical picture, the market did not react to another set of statements like "we need to wait," "we need more evidence of slowing inflation," and so on.
In our opinion, Powell showed a hawkish stance because the Fed continues to maintain its firm stance while the market has been expecting the first rate cut for half a year. However, the market itself does not seem to acknowledge its own mistake. The probability of a rate cut in September is around 70%, according to the CME FedWatch tool. We absolutely do not understand where such a high belief in policy easing at the beginning of autumn comes from. Recall that most experts were expecting a rate cut back in March, and at that time, the probability of a rate cut was also high. Even if inflation drops to 3.1% on Thursday, as forecasted, it will not be enough to start easing policy.
There were no trading signals on Tuesday. The price gradually declined all day from the 1.0836 level to the 1.0797 level, and neither level was fully worked out. Short positions were possible but only if they were opened on Monday, but even then, there was no clear rebound from the 1.0836 level. It is to be noted that with low volatility, any levels and any trading signals will not yield significant profits. The market is simply trading during stagnation.
COT report:

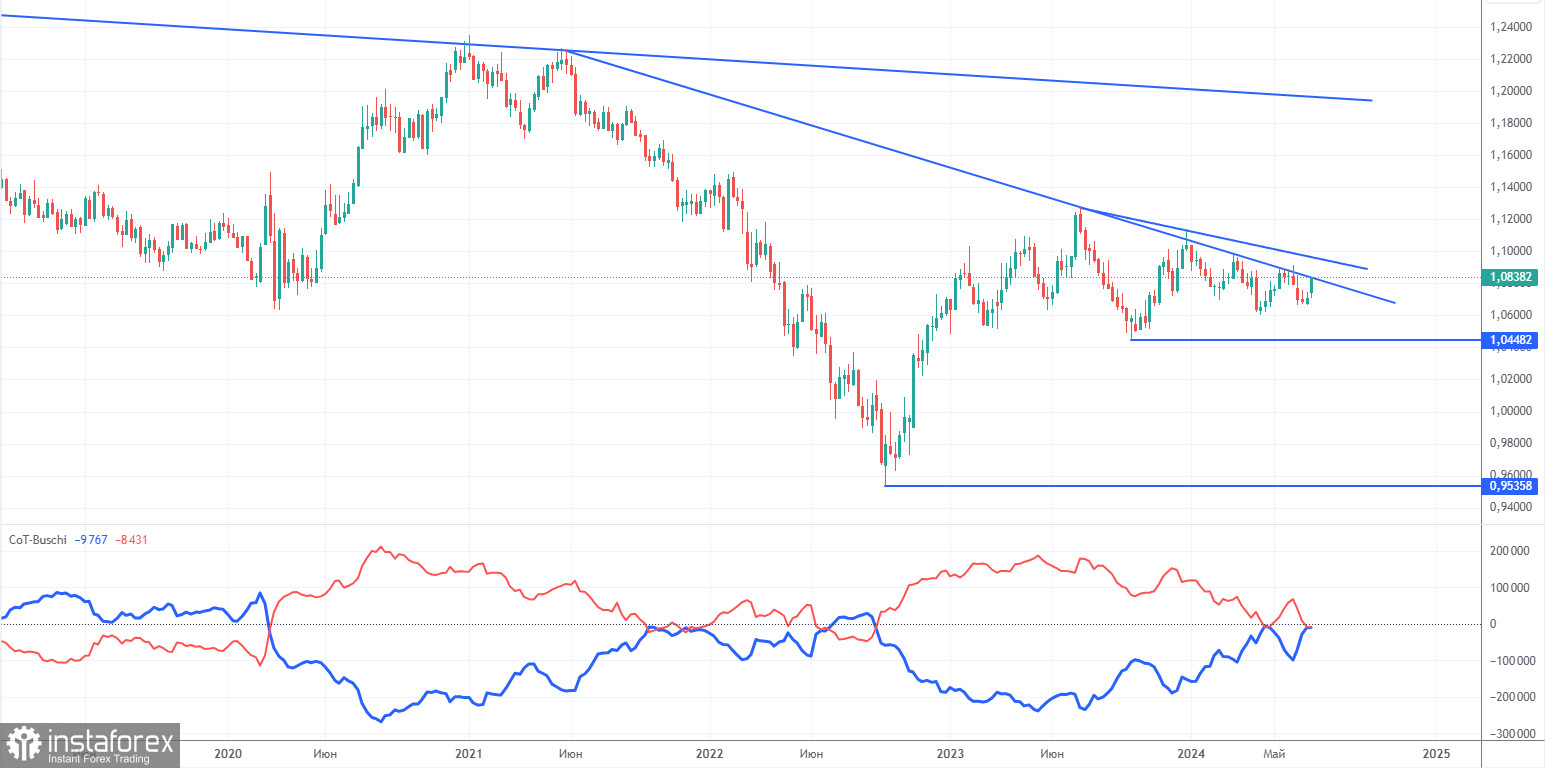
The latest COT report is dated June 25. The net position of non-commercial traders has remained bullish for a long time and remains so. The bears' attempt to gain dominance failed miserably. The net position of non-commercial traders (red line) has been declining in recent months, while that of commercial traders (blue line) has been growing. Currently, they are approximately equal, indicating the bears' new attempt to seize the initiative.
We don't see any fundamental factors that can support the euro's strength in the long term, while technical analysis also suggests a continuation of the downtrend. Three descending trend lines on the weekly chart suggests that there's a good chance of further decline. In any case, the downward trend is not broken.
Currently, the red and blue lines are approaching each other, which indicates a build-up in short positions on the euro. During the last reporting week, the number of long positions for the non-commercial group decreased by 4,100, while the number of short positions increased by 12,300. As a result, the net position decreased by 16,400. According to the COT reports, the euro still has significant potential for a decline.
Analysis of EUR/USD 1H

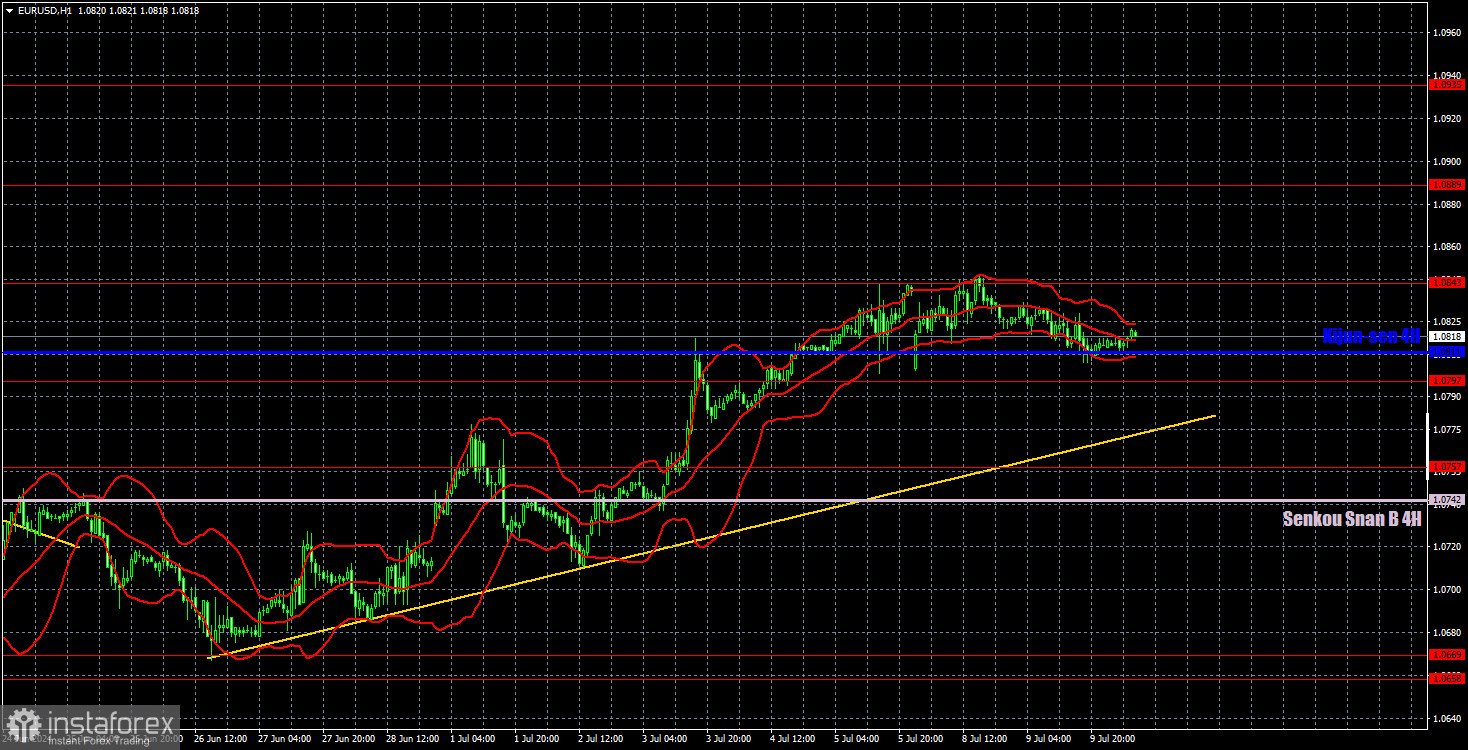
On the 1-hour chart, EUR/USD failed to break through the 1.0658-1.0669 area and decided to form a new upward trend. We currently have an ascending trend line, above which the upward trend persists. It may end this week, but it will take at least a few days for the price to fall to the trendline. It is impossible to confirm the end of the uptrend without breaking through this line and the Ichimoku indicator lines. Moreover, the US inflation report could mount pressure on the dollar.
On July 10, we highlight the following levels for trading: 1.0530, 1.0581, 1.0658-1.0669, 1.0757, 1.0797, 1.0843, 1.0889, 1.0935, 1.1006, 1.1092, as well as the Senkou Span B line (1.0742) and Kijun-sen line (1.0811). The Ichimoku indicator lines can move during the day, so this should be taken into account when identifying trading signals. Don't forget to set a Stop Loss to breakeven if the price has moved in the intended direction by 15 pips. This will protect you against potential losses if the signal turns out to be false.
Powell's second round of testifying is due on Wednesday. Theoretically, this event could provoke a market reaction, but yesterday we did not hear anything interesting from Powell. Thus, it is unlikely that we can expect any significant statements from him today.
Description of the chart:
Support and resistance levels are thick red lines near which the trend may end. They do not provide trading signals;
The Kijun-sen and Senkou Span B lines are the lines of the Ichimoku indicator, plotted to the 1H timeframe from the 4H one. They provide trading signals;
Extreme levels are thin red lines from which the price bounced earlier. They provide trading signals;
Yellow lines are trend lines, trend channels, and any other technical patterns;
Indicator 1 on the COT charts is the net position size for each category of traders;
 English
 Русский
 Bahasa Indonesia
 Bahasa Malay
 ไทย
ไทย Español
 Deutsch
 Български
 Français
 Tiếng Việt
 中文
中文 বাংলা
বাংলা हिन्दी
 Čeština
 Українська
 Română

