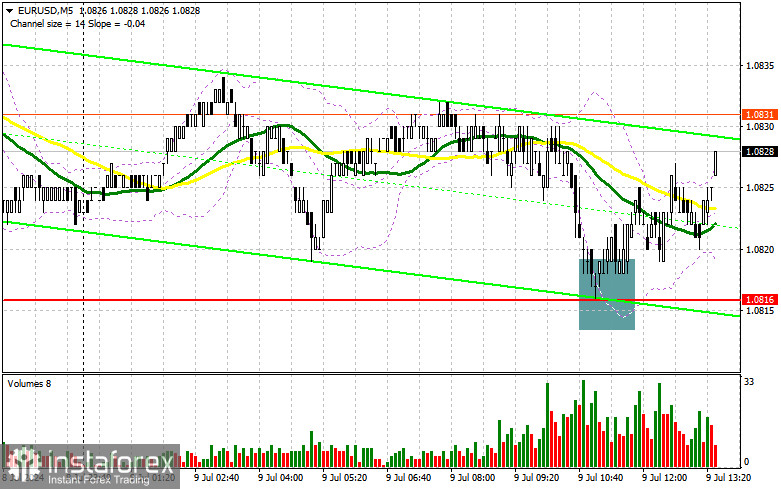
In my morning forecast, I highlighted the 1.0816 level and planned to make market entry decisions from it. Let's look at the 5-minute chart and analyze what happened. The decline and formation of a false breakout at 1.0816 led to a point for entering long positions, which resulted in a 12-point increase at the time of writing. The technical picture for the second half of the day has stayed the same.

To Open Long Positions on EUR/USD:
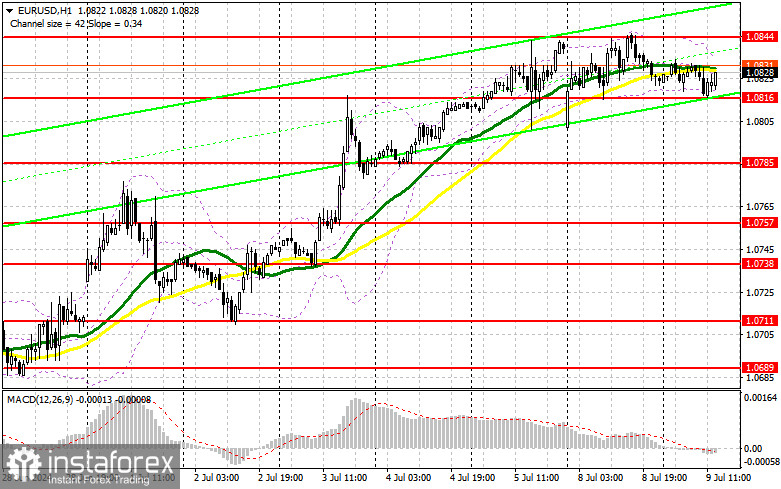
Given the lack of statistics from the Eurozone, it's not surprising that buyers managed to defend the 1.0816 level without much trouble. However, everything could change drastically in the second half of the day, though I am leaning towards further development of the upward trend. We have a series of speeches from American politicians ahead. It starts with Federal Reserve Chairman Jerome Powell and ends with speeches from FOMC member Michelle Bowman and Treasury Secretary Janet Yellen. Euro growth will be ensured if Powell's speech is dovish. If the focus is on continued inflation fighting, the pair could significantly drop, which I intend to capitalize on. Similar to what I discussed above, a decline and formation of a false breakout at 1.0816 will be a suitable point for entering long positions to recover the euro to the area of 1.0844 – the new weekly high. A breakout and top-down update of this range amid Powell's dovish rhetoric will strengthen the pair, with a chance to rise to resistance at 1.0871. The furthest target will be the maximum at 1.0899, where I plan to take profit. Testing this level will allow the bullish trend to continue. If EUR/USD declines and shows no activity around 1.0816 in the second half of the day, where the moving averages supporting the bulls are located, I will only enter long positions after a false breakout at the next support level of 1.0785. I plan to open long positions on a rebound from the minimum of 1.0757, with the target of an upward correction of 30-35 points within the day.
To Open Short Positions on EURUSD:
Sellers tried, but with support from major market players, they can do more. Only a false breakout around the new resistance at 1.0844 during Jerome Powell's speech will provide a suitable point for entering short positions to fall to support at 1.0816, where the moving averages supporting the bulls are located. A breakout and consolidation below this range, followed by a bottom-up retest, will return pressure on the euro and provide another point for selling with a move to the minimum of 1.0785, where I expect more active buying of the euro. The furthest target will be the area of 1.0757, where I plan to take profit. If EUR/USD moves up in the second half of the day and there are no bears at 1.0844 after a dovish speech from the Fed Chairman, which is quite likely, buyers will be able to achieve further growth of the pair. In this case, I will postpone sales until the next resistance test at 1.0871. I will also sell there, but only after an unsuccessful consolidation. I plan to open short positions on a rebound immediately from 1.0899 with the aim of a downward correction of 30-35 points.


Indicator Signals:
Moving Averages:
Trading is around the 30 and 50-day moving averages, indicating a sideways market.
Note: The period and prices of moving averages considered by the author are on the H1 hourly chart and differ from the general definition of classic daily moving averages on the D1 daily chart.
Bollinger Bands:
In case of a decline, the lower boundary of the indicator, around 1.0816, will act as support.
Indicator Descriptions:
- Moving Average (MA): Determines the current trend by smoothing volatility and noise. Period 50. Marked in yellow on the chart.
- Moving Average (MA): Determines the current trend by smoothing volatility and noise. Period 30. Marked in green on the chart.
- MACD (Moving Average Convergence/Divergence): Fast EMA period 12. Slow EMA period 26. SMA period 9.
- Bollinger Bands: Period 20.
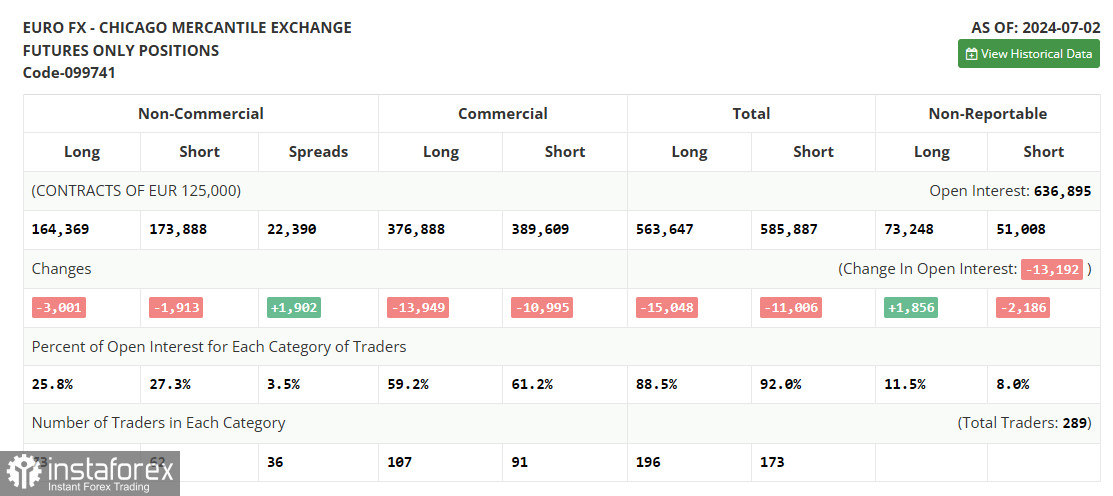
- Non-Commercial Traders: Speculators such as individual traders, hedge funds, and large institutions use the futures market for speculative purposes and meet certain requirements.
- Long Non-Commercial Positions: Represent the total long open position of non-commercial traders.
- Short Non-Commercial Positions: Represent the total short open position of non-commercial traders.
- Total Non-Commercial Net Position: The difference between short and long positions of non-commercial traders.
 English
 Русский
 Bahasa Indonesia
 Bahasa Malay
 ไทย
ไทย Español
 Deutsch
 Български
 Français
 Tiếng Việt
 中文
中文 বাংলা
বাংলা हिन्दी
 Čeština
 Українська
 Română

