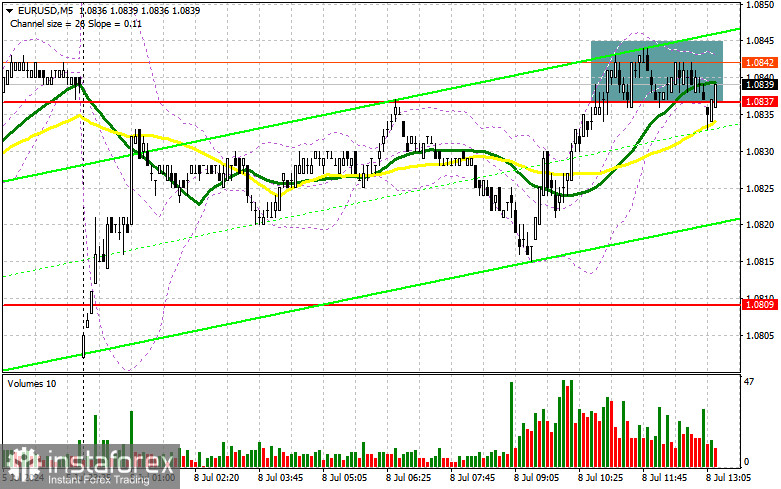
I focused on the 1.0837 level in my morning forecast and planned to make market entry decisions from there. Let's look at the 5-minute chart and analyze what happened. A rise and the formation of a false breakout at 1.0837 took place. Still, an active downward movement has yet to materialize, indicating a lack of willingness to sell the euro even at current levels. As a result, I decided to exit the market and reconsidered the technical picture for the second half of the day.

To open long positions on EUR/USD, you need:
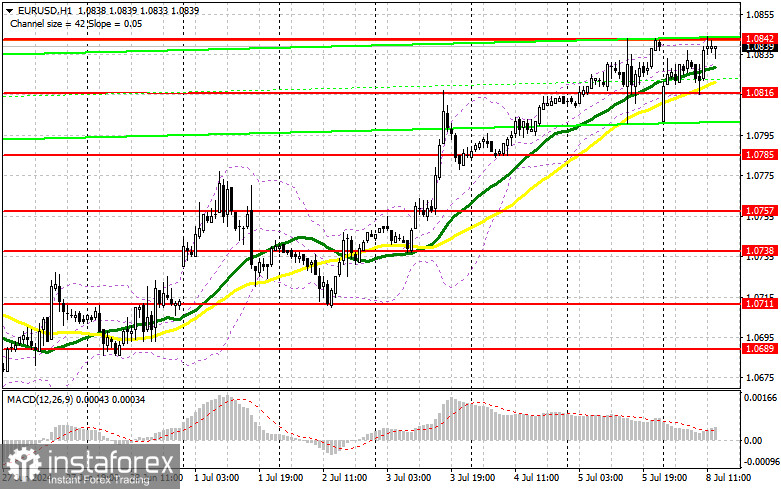
Traders completely ignored the weak data on investor sentiment in the eurozone, confirming the short-term preference for risky assets. In the second half of the day, apart from the consumer credit volume figures in the US, nothing else is expected, so the lack of active buyer actions around daily and monthly highs could negatively impact the pair's prospects. For this reason, I plan to act lower within the sideways channel. A decline and formation of a false breakout at 1.0816 will be an appropriate entry point for long positions to restore the euro towards the 1.0842 area – the new weekly high. A breakout and top-down update of this range amid weak US statistics will strengthen the pair with a chance to rise to the resistance at 1.0871. The maximum target will be 1.0899, where I will take profits. Testing this level will allow the bullish trend to continue. In case of a decline in EUR/USD and a lack of activity around 1.0816 in the second half of the day (with moving averages passing in that area, favoring the bulls), I will enter only after forming a false breakout around the next support at 1.0785. I plan to open long positions immediately on a rebound from the minimum of 1.0757, with the target of an intraday upward correction of 30-35 points.
To open short positions on EUR/USD, you need:
Sellers are not in a hurry to return to the market yet. As I noted above, there is no significant US data, so another failed attempt to break the daily high may positively affect bearish sentiment, leading to a pair correction. Similar to what I discussed above, a false breakout around the new resistance at 1.0842 will provide a suitable entry point for short positions, aiming to drop the pair to support at 1.0816, where the moving averages favor the bulls. A breakout and consolidation below this range, followed by a bottom-up retest, will give another selling point, targeting the 1.0785 minimum, where I expect more active euro buyers. The ultimate target will be the area at 1.0757, where I will take profits. Buyers will likely achieve further growth if EUR/USD moves up in the second half of the day and there are no bears at 1.0842. In that case, I will postpone sales until testing the next resistance at 1.0871. I will also sell there, but only after an unsuccessful consolidation. I plan to open short positions immediately on a rebound from 1.0899 with the target of a downward correction of 30-35 points.


Indicator Signals:
Moving Averages:
Trading is conducted above the 30 and 50-day moving averages, indicating a potential euro growth.
Note: The author considers the period and prices of moving averages on the H1 hourly chart, which differs from the general definition of classical daily moving averages on the D1 daily chart.
Bollinger Bands:
In case of a decline, the lower boundary of the indicator, around 1.0816, will act as support.
Indicator Descriptions:
- Moving average: Determines the current trend by smoothing out volatility and noise. Period – 50. Marked in yellow on the chart.
- Moving average: Determines the current trend by smoothing out volatility and noise. Period – 30. Marked in green on the chart.
- MACD Indicator (Moving Average Convergence/Divergence): Fast EMA – period 12. Slow EMA – period 26. SMA – period 9.
- Bollinger Bands: Period – 20.
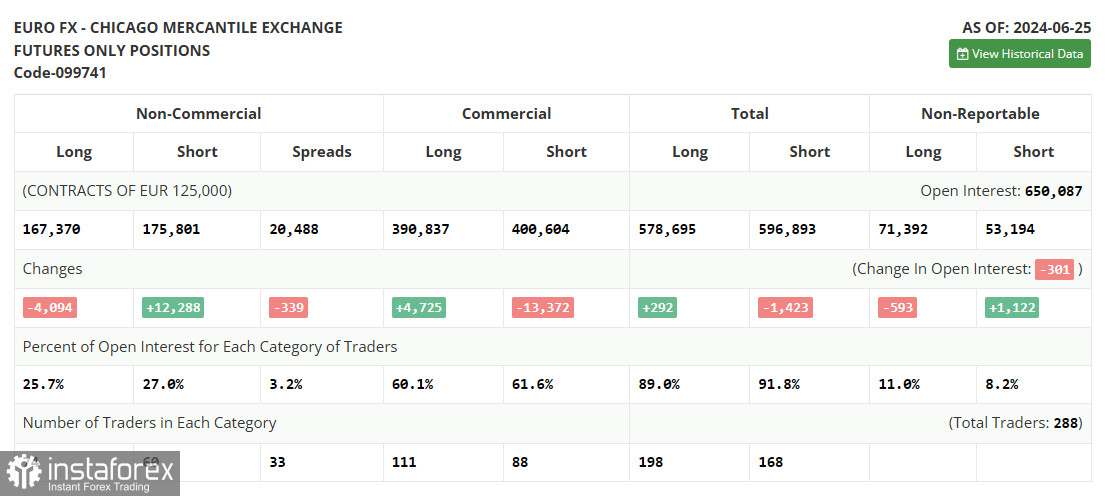
- Non-commercial traders are speculators such as individual traders, hedge funds, and large institutions that use the futures market for speculative purposes and meet certain requirements.
- Long non-commercial positions: Represent the total long open position of non-commercial traders.
- Short non-commercial positions: Represent the total short open position of non-commercial traders.
- Total non-commercial net position: The difference between short and long positions of non-commercial traders.
 English
 Русский
 Bahasa Indonesia
 Bahasa Malay
 ไทย
ไทย Español
 Deutsch
 Български
 Français
 Tiếng Việt
 中文
中文 বাংলা
বাংলা हिन्दी
 Čeština
 Українська
 Română

