 English
  Русский
 Bahasa Indonesia
 Bahasa Malay
 ไทย
ไทย Español
 Deutsch
 Български
 Français
 Tiếng Việt
 中文
中文 বাংলা
বাংলা हिन्दी
 Čeština
 Українська
 Română

Analysis of macroeconomic reports:
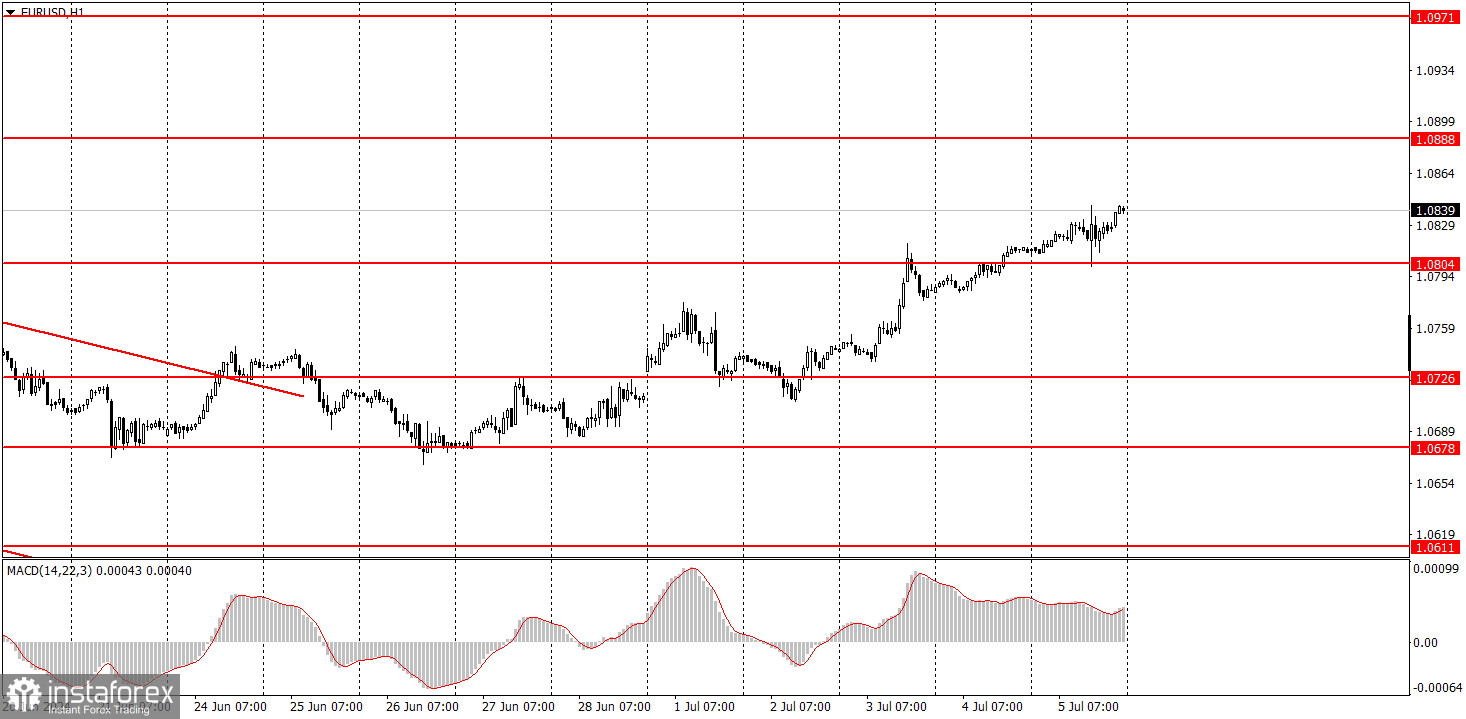
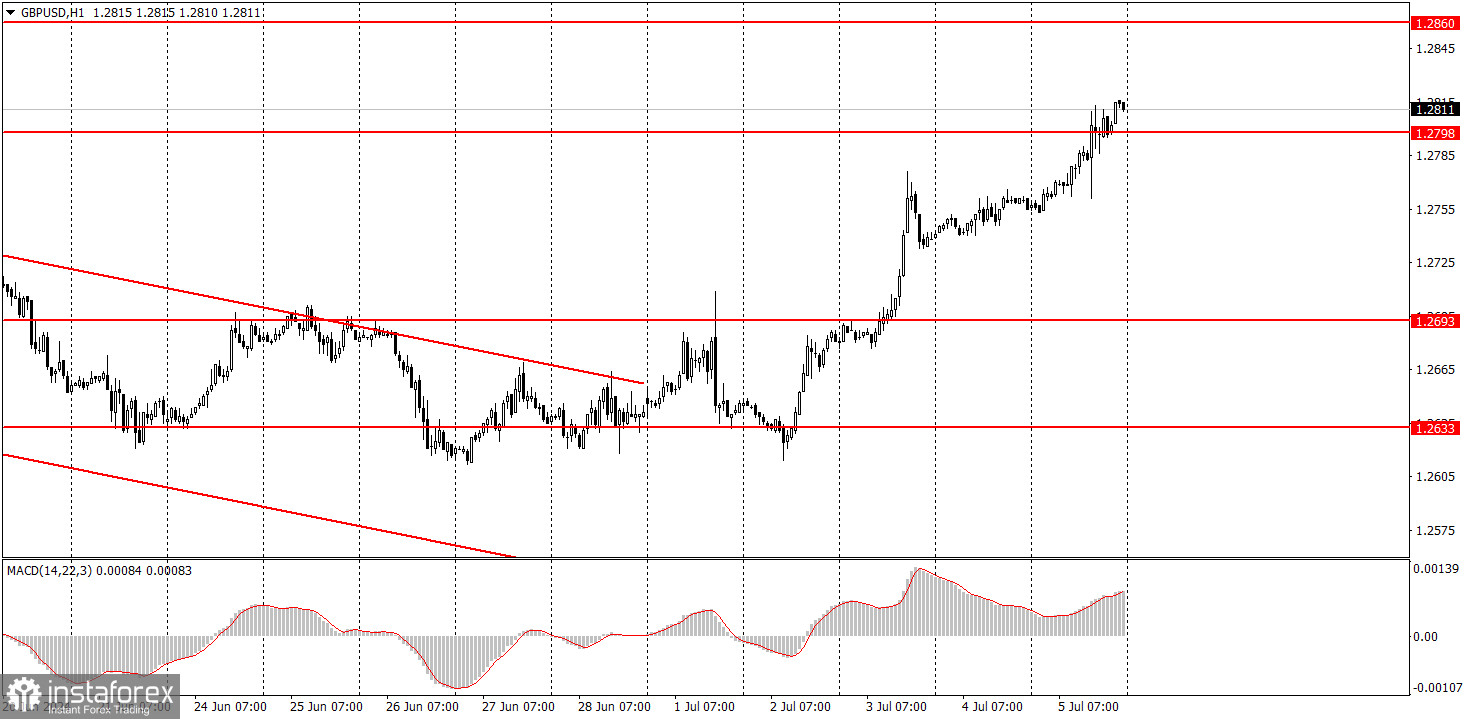
The economic calendar is empty on Monday. Last week, both currency pairs experienced low volatility and gradually moved higher. It was logical for the dollar to fall last week, as nearly all key reports on the American economy turned out weaker than forecasts. However, it is worth mentioning that at the same time, the European Central Bank has begun easing monetary policy, which is a bearish factor for the euro. The Bank of England is also likely to start easing policy on August 1, which is also a bearish factor for the British pound. Therefore, we are very skeptical about further growth. But we can't deny that the market is reluctant to buy the US dollar.
Analysis of fundamental events:
There are no significant fundamental events to highlight for Monday. The market clearly understands what to expect from the Federal Reserve, the ECB, and the BoE, so the market doesn't focus on any speeches by representatives of these central banks. Moreover, market participants are trying to brush off the fact that the Eurozone and the UK are easing their monetary policies.
General conclusions:
There will be no significant events on the first trading day of the new week. Most likely, both pairs will try to correct slightly to the downside, but volatility will be low, making it difficult to recognize any movement on the charts. The euro and the pound have reacted to weak US data, so they might retreat for a bit now.
Basic rules of a trading system:
1) Signal strength is determined by the time taken for its formation (either a bounce or level breach). A shorter formation time indicates a stronger signal.
2) If two or more trades around a certain level are initiated based on false signals, subsequent signals from that level should be disregarded.
3) In a flat market, any currency pair can produce multiple false signals or none at all. In any case, the flat trend is not the best condition for trading.
4) Trading activities are confined between the onset of the European session and mid-way through the U.S. session, after which all open trades should be manually closed.
5) On the 30-minute timeframe, trades based on MACD signals are only advisable amidst substantial volatility and an established trend, confirmed either by a trendline or trend channel.
6) If two levels lie closely together (ranging from 5 to 15 pips apart), they should be considered as a support or resistance zone.
How to read charts:
Support and Resistance price levels can serve as targets when buying or selling. You can place Take Profit levels near them.
Red lines represent channels or trend lines, depicting the current market trend and indicating the preferable trading direction.
The MACD(14,22,3) indicator, encompassing both the histogram and signal line, acts as an auxiliary tool and can also be used as a signal source.
Significant speeches and reports (always noted in the news calendar) can profoundly influence the price dynamics. Hence, trading during their release calls for heightened caution. It may be reasonable to exit the market to prevent abrupt price reversals against the prevailing trend.
Beginners should always remember that not every trade will yield profit. Establishing a clear strategy coupled with sound money management is the cornerstone of sustained trading success.