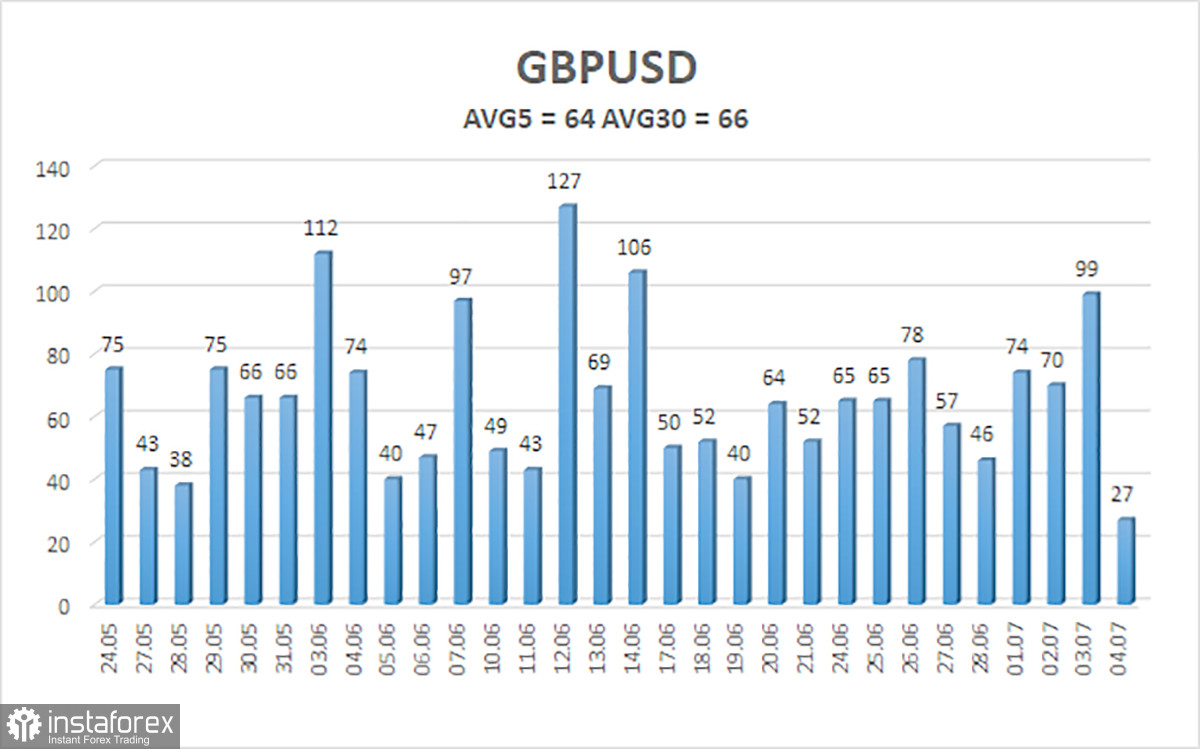
GBP/USD did not show any interesting movements on Thursday. US markets were closed for the celebration of Independence Day, so it was unlikely for the pair to show sharp movements. The pair showed an impressive upward movement on Wednesday, which we have rarely observed in recent months. The chart below clearly shows how often the pound has been trading with a volatility of 100 pips or higher in recent months. So initially we did not expect anything interesting on Thursday.
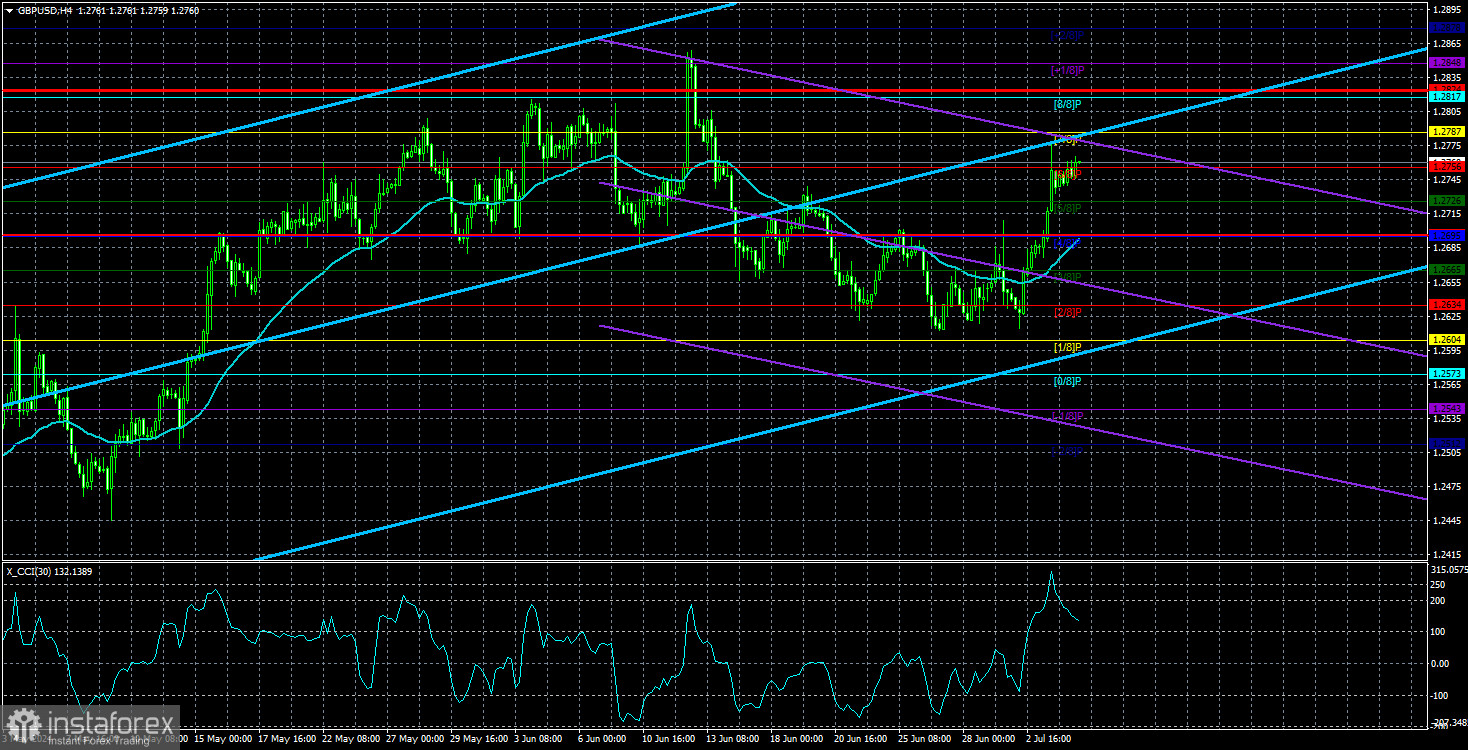
On the 4-hour timeframe, the pound continues to trade erratically. There is no clear trend, movements are weak, and the British pound refuses to fall. This week, the dollar went through another "rollercoaster" due to a new batch of weak US macro data. The market, which is ready to buy the British currency even without the corresponding background, eagerly rushed to sell the dollar as soon as it received disappointing data on the US. As before, the market uses any opportunity to buy the pound and sell the dollar. No logical and reasonable movements are occurring now.
To someone, it may seem that everything looks quite good from a technical perspective. We can only advise switching to the 24-hour timeframe and see how the pound has been moving over the last nine months. We have a flat range between the levels of 1.23 and 1.28, within which there are at least two more flats between the levels of 1.2550 and 1.2850. The most interesting and surprising thing is that these flats do not even have clear boundaries. The pair shows random movements. For comparison, any trader can scroll back the chart a bit and see what a trend looks like and what a normal movement is, on which one can work and earn.
Therefore, in the current situation, it is crucial to understand that the market is dealing with such a period where it is very difficult to expect high profits and good movements. Essentially, there is no trend now, and the price constantly changes direction. The market doesn't even consider the fundamental background, and participants are simply looking for a reason to sell the dollar.
The last trading day of the week does not promise anything good. Reports on Nonfarm Payrolls and unemployment will be published in the US, which can easily send the dollar into another "nosedive." The US dollar does not need much to fall right now. If the Nonfarm Payrolls turn out to be 5-10,000 worse than the forecast (190,000), that will be enough for the market to sell the dollar again. The same applies to the unemployment rate. Any value above 4% will provoke the US dollar's weakness. It does not matter that unemployment in Europe is one and a half times higher. It does not matter that the European economy showed a maximum growth of 0.3% over the last six quarters, while the minimum GDP growth in the US for the same period was 1.4%. But, according to the market, the US economy is on the verge of collapse, while everything is fine in Europe.

The average volatility of GBP/USD over the last five trading days is 64 pips. This is considered an average value for the pair. Today, we expect GBP/USD to move within a range bounded by the levels of 1.2696 and 1.2824. The higher linear regression channel is pointing upwards, which suggests that the upward trend will continue. The CCI indicator entered the overbought area this week and drew divergence from the last two highs.
Nearest support levels:
S1 - 1.2726
S2 - 1.2695
S3 - 1.2665
Nearest resistance levels:
R1 - 1.2756
R2 - 1.2787
R3 - 1.2817
Trading Recommendations:
The GBP/USD pair has once again consolidated above the moving average line and is growing by leaps and bounds for the second consecutive day. After consolidating below the moving average line and overcoming the area of 1.2680-1.2695, the pound has better chances of falling further, but the market is not in a hurry to sell. Traders should be cautious with any positions on the British currency. There is still no reason to buy it (except for isolated cases), and it is also risky to sell, because the market ignored the fundamental and macroeconomic background for two months, and still insists on doing the same thing. From our perspective, traders may consider short positions with targets of 1.2604 and 1.2573, if we're talking about a logical and natural kind of movement. However, the pound is not even able to correct lower.
Explanation of Illustrations:
- Linear Regression Channels – Helps determine the current trend. If both are directed in the same direction, it means the trend is currently strong.
- Moving Average Line (settings 20.0, smoothed) – Determines the short-term trend and the direction in which trading should currently be conducted.
- Murray Levels – Target levels for movements and corrections.
- Volatility Levels (red lines) – The probable price channel in which the pair will spend the next day, based on current volatility indicators.
- CCI Indicator – Its entry into the oversold area (below -250) or the overbought area (above +250) means that a trend reversal in the opposite direction is imminent.
 English
 Русский
 Bahasa Indonesia
 Bahasa Malay
 ไทย
ไทย Español
 Deutsch
 Български
 Français
 Tiếng Việt
 中文
中文 বাংলা
বাংলা हिन्दी
 Čeština
 Українська
 Română

