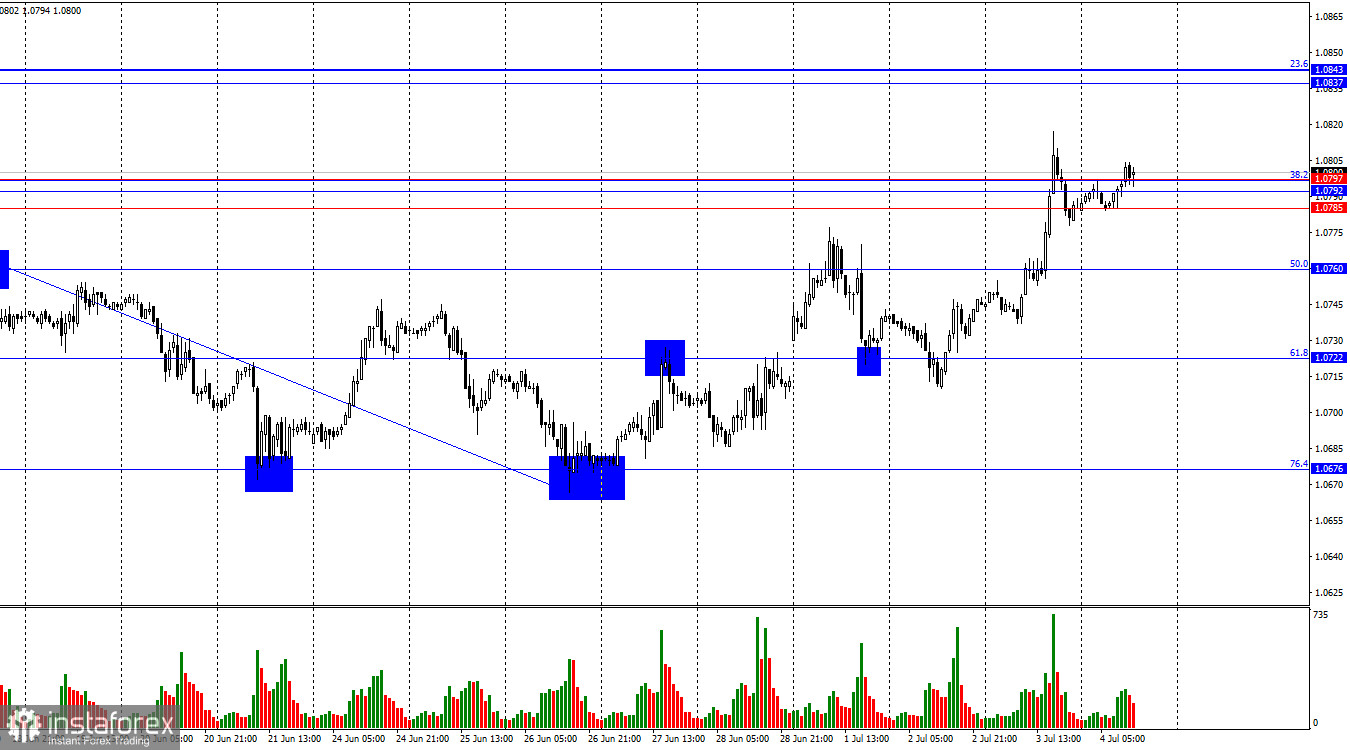
The wave situation has become more complicated this week. A new upward wave broke the peak of the previous wave, while the most recent downward wave did not break the low of the previous wave. Thus, two signs indicate a trend change from bearish to bullish. Initially, the peak from June 18th was broken by just a few points, which cast doubt on the bulls' readiness for a full trend. However, this week, they received crucial support from the news background, leading to a more confident breakthrough.
The news background on Wednesday condemned the dollar. The American currency might not fall too sharply this time, but a steady stream of negative news continues to flow from the USA. The economy is slowing down, unemployment is rising, and inflation remains high. Yesterday, it was revealed that the ADP employment change was only 150,000 in June, while traders expected a higher figure. At the same time, the ISM non-manufacturing PMI dropped to 48.8 from 53.8. These two reports alone were enough for the bears to retreat and for the bulls to launch a large-scale attack. As I said before, on Friday, the bulls might start retreating from the market, but for now, they are attacking because the news background favors it. I don't think the euro can soar far on economic statistics alone, but the fact remains – the dollar can't show growth with such data from the USA either.

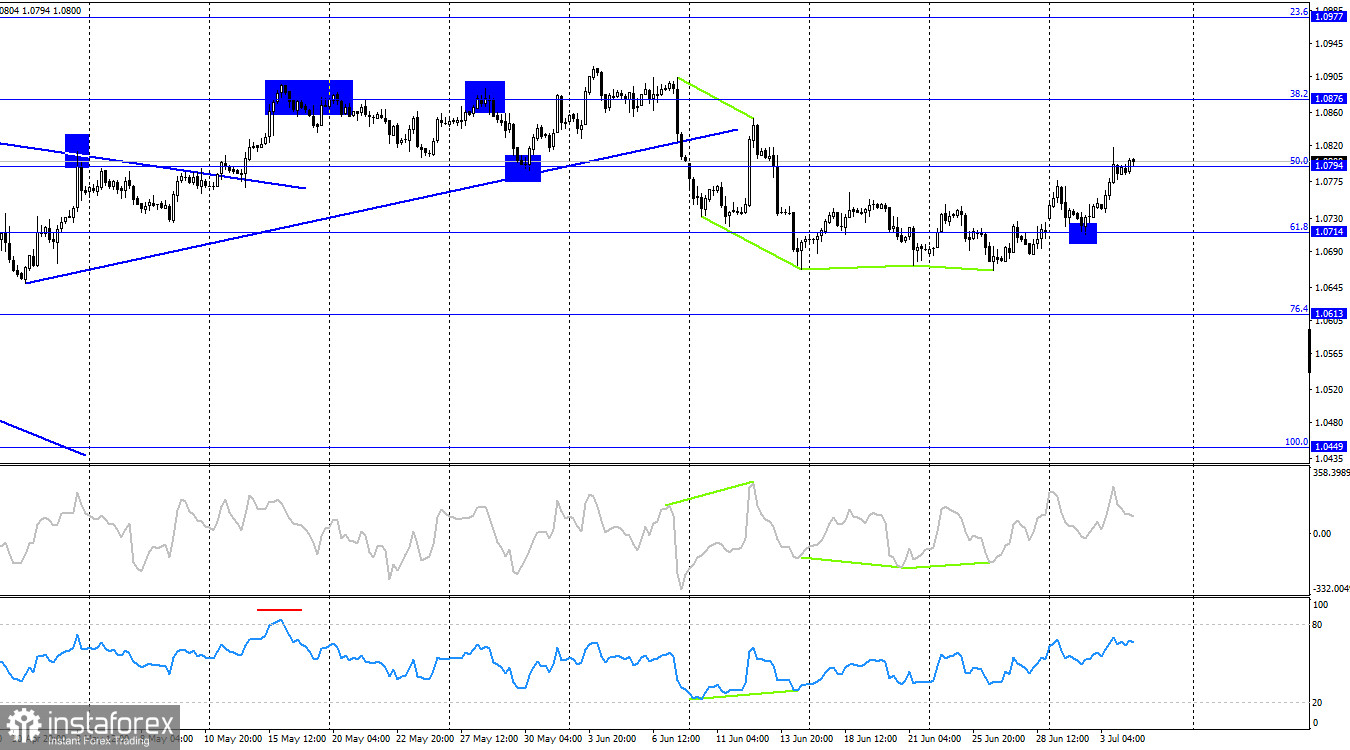
On the 4-hour chart, the pair made a new reversal in favor of the euro after forming a new bullish divergence on the CCI indicator and rebounding from the corrective level of 61.8%–1.0714. Currently, the pair is trading around the Fibonacci level of 50.0%–1.0794. A rebound from this level could bring the bears back to the market, but they will still need news support to bring the pair back to at least 1.0714. Consolidation above 1.0794 will pave the way for further growth towards the next corrective level of 38.2%–1.0876.
Commitments of Traders (COT) Report:

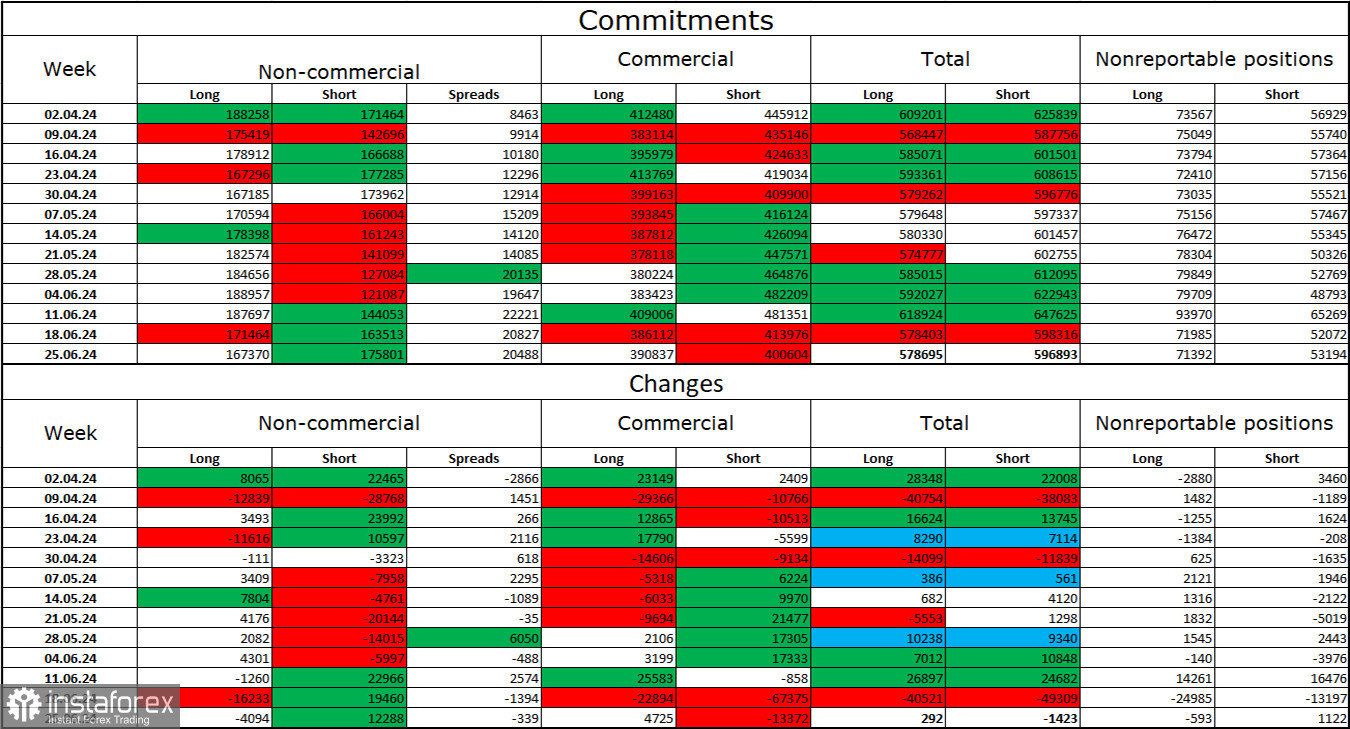
During the last reporting week, speculators closed 4,094 long positions and opened 12,288 short positions. The sentiment of the "Non-commercial" group turned bearish several weeks ago and is now strengthening. The total number of long positions held by speculators is now 167 thousand, while short positions are 175 thousand.
The situation will continue to shift in favor of the bears. I see no long-term reasons to buy the euro, as the ECB has started easing monetary policy, which will lower the yields on bank deposits and government bonds. In America, they will remain high for at least a few more months, making the dollar more attractive to investors. The potential for the euro's decline, even according to the COT reports, looks significant. Currently, the number of short positions among professional players is growing.
Economic Calendar for the USA and the Eurozone:
The economic events calendar does not contain any interesting entries on July 4th. Therefore, today, the impact of the news background on traders' sentiment will be absent.
Forecast for EUR/USD and Trading Tips:
Sales of the pair are now possible upon consolidation on the hourly chart below the zone of 1.0785–1.0797 with targets of 1.0760 and 1.0722. New purchases are possible upon closing above the indicated zone with a target of 1.0843.
The Fibonacci level grids are built from 1.0602 to 1.0917 on the hourly chart and from 1.0450 to 1.1139 on the 4-hour chart.
 English
 Русский
 Bahasa Indonesia
 Bahasa Malay
 ไทย
ไทย Español
 Deutsch
 Български
 Français
 Tiếng Việt
 中文
中文 বাংলা
বাংলা हिन्दी
 Čeština
 Українська
 Română

