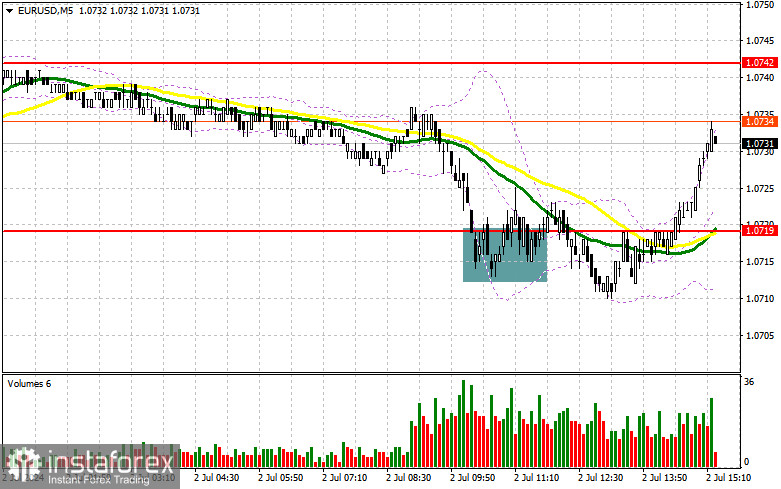
In my morning forecast, I highlighted the level of 1.0719 and planned to make trading decisions based on it. Let's look at the 5-minute chart and understand what happened there. A decline and the formation of a false breakout at 1.0719 led to a buy signal, resulting in a 10-point rise in the pair. After that, demand for the euro decreased. The technical picture was revised for the second half of the day.

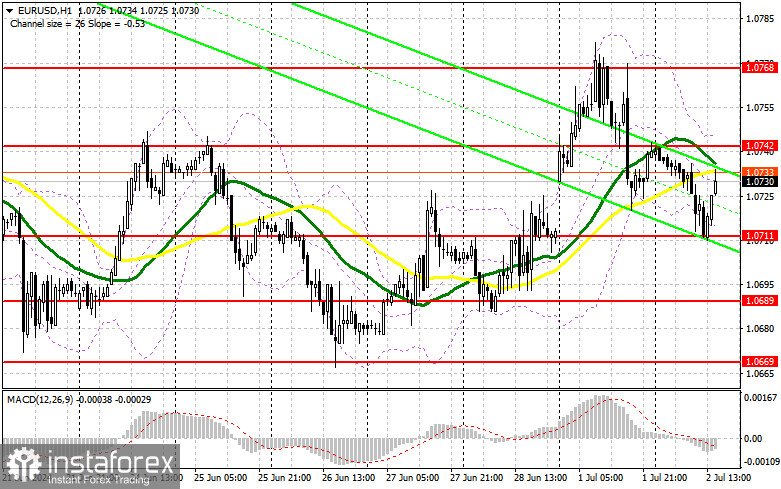
To open long positions on EURUSD, the following is required:The fact that the inflation data in the eurozone matched economists' forecasts allowed euro buyers to stay afloat. Inflation has resumed its downward trajectory, but everything is still within expectations. During the American session, there are no important reports, so all attention will shift to the speech by Federal Reserve Chairman Jerome Powell. The Bureau of Labor Statistics' Job Openings and Labor Turnover Survey will be less interesting. Therefore, if Powell reiterates the Fed's hawkish stance, it is likely that pressure on the euro will return, which I plan to take advantage of. A decline and the formation of a false breakout at 1.0711, similar to what I discussed earlier, will be a suitable entry point for long positions to recover the euro to the area of 1.0742, where the moving averages slightly below favor the sellers. A breakout and upward test of this range will strengthen the pair with a chance to rise to the resistance at 1.0768. The furthest target will be the maximum at 1.0791, where I will be taking profits. Testing this level will give buyers an advantage. In the event of a decline in EUR/USD and a lack of activity around 1.0711 in the second half of the day, I will only enter after forming a false breakout around the next support at 1.0689. I plan to open long positions immediately on a rebound from the monthly low of 1.0669 with the aim of a 30-35 point upward correction within the day.To open short positions on EURUSD, the following is required:Sellers have shown their presence, but it is still too early to say that the market is under their control. Only a hawkish stance from Powell will help defend the nearest resistance at 1.0742, where the pair is currently heading. A false breakout there will provide a suitable entry point for short positions, aiming for a new pair decline to the day's low of 1.0711. A breakout and consolidation below this range, supported by strong statistics from the Bureau of Labor Statistics, and an upward retest will provide another selling point, targeting the minimum at 1.0689, where I expect to see more active bullish behavior. The furthest target will be the area of 1.0669, where I will be taking profits. If EUR/USD moves upward in the second half of the day and there are no bears at 1.0742, which is also possible, buyers will manage to push the pair higher already at the start of the month. In that case, I will postpone selling until the next resistance at 1.0768 is tested. I will also sell there, but only after a failed consolidation. I plan to open short positions immediately on a rebound from 1.0791, aiming for a 30-35 point downward correction.

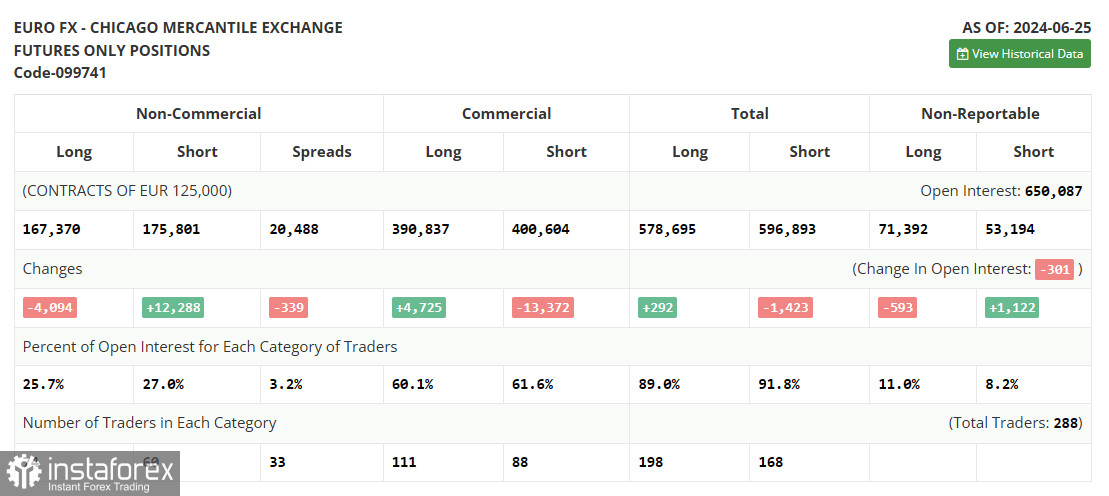
The COT report (Commitment of Traders) for June 25 showed an increase in short positions and a reduction in long ones. It is obvious that the ongoing policy of the Federal Reserve System and the European Central Bank continues to affect risky assets, and the fact that no one is going to change anything yet will continue to strengthen the dollar. The COT report indicates that long non-commercial positions decreased by 4,094 to 167,370, while short non-commercial positions increased by 12,288 to 175,801. As a result, the spread between long and short positions decreased by 339.

Indicator Signals:Moving AveragesTrading is below the 30 and 50-day moving averages, indicating a potential decline in the euro.Note: The author considers the period and prices of the moving averages on the H1 hourly chart, which differs from the general definition of classic daily moving averages on the D1 daily chart.Bollinger BandsIn case of a decline, the indicator's lower boundary, around 1.0711, will act as support.Description of Indicators
- Moving average (determines the current trend by smoothing volatility and noise). Period 50. Marked in yellow on the chart.
- Moving average (determines the current trend by smoothing volatility and noise). Period 30. Marked in green on the chart.
- MACD indicator (Moving Average Convergence/Divergence). Fast EMA period 12. Slow EMA period 26. SMA period 9.
- Bollinger Bands. Period 20.
- Non-commercial traders are speculators such as individual traders, hedge funds, and large institutions that use the futures market for speculative purposes and meet certain criteria.
- Long non-commercial positions represent the total long open position of non-commercial traders.
- Short non-commercial positions represent the total short open positions of non-commercial traders.
- Total non-commercial net position is the difference between short and long positions of non-commercial traders.
*The market analysis posted here is meant to increase your awareness, but not to give instructions to make a trade


 English
 Русский
 Bahasa Indonesia
 Bahasa Malay
 ไทย
ไทย Español
 Deutsch
 Български
 Français
 Tiếng Việt
 中文
中文 বাংলা
বাংলা हिन्दी
 Čeština
 Українська
 Română

