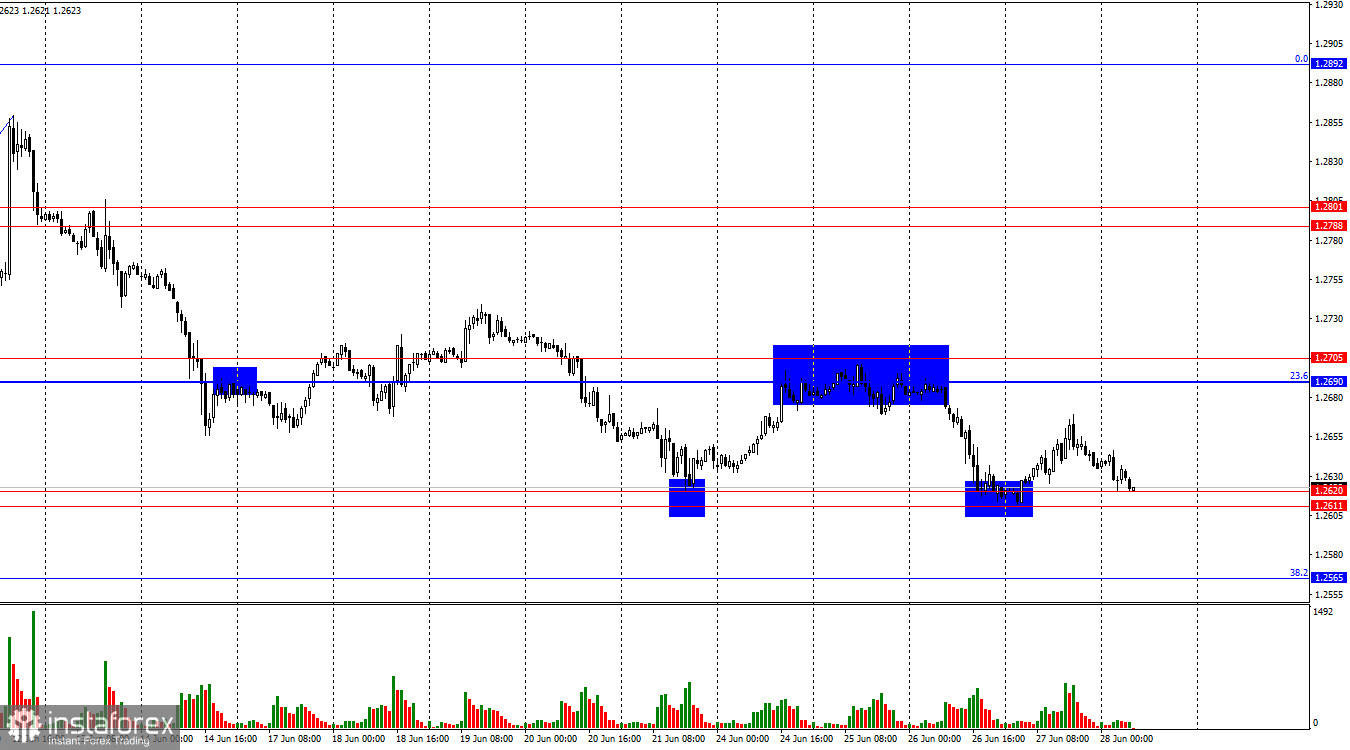
On the hourly chart, the GBP/USD pair rebounded yesterday from the support zone of 1.2611–1.2620 and saw a slight increase. Today, the pair returned to this zone. Another rebound from this zone would favor the British pound again and could lead to some growth towards the resistance zone of 1.2690–1.2705. If the pair consolidates below this zone, it will increase the probability of further decline toward the next corrective level of 38.2% (1.2565).

The wave situation remains unchanged. The recent upward wave has surpassed the peak from June 4, while a new downward wave (still forming) managed to break the low of the wave from June 10. Thus, the trend for the GBP/USD pair has shifted to "bearish." I am cautious about concluding that a "bearish" trend has started, as bulls have not entirely left the market. The emerging advantage of bears could be broken. However, the zone of 1.2690–1.2705 shows that bears still have slightly better prospects than bulls.
On Thursday, the news background supported bullish traders. The US GDP slowed by almost 2% in the first quarter, and orders for durable goods in April were weaker than indicated by the previous report. The slight May overperformance no longer mattered to the market. However, the dollar did not retreat significantly. Today, it has already managed to regain all lost positions. The report on British GDP could keep the pair above the zone of 1.2611–1.2620. Today's news background will not be the most significant for traders. I believe that very strong data for the US currency will be needed for bears to secure positions below the zone of 1.2611–1.2620. If such data arrives, we can expect the pair to continue declining today.

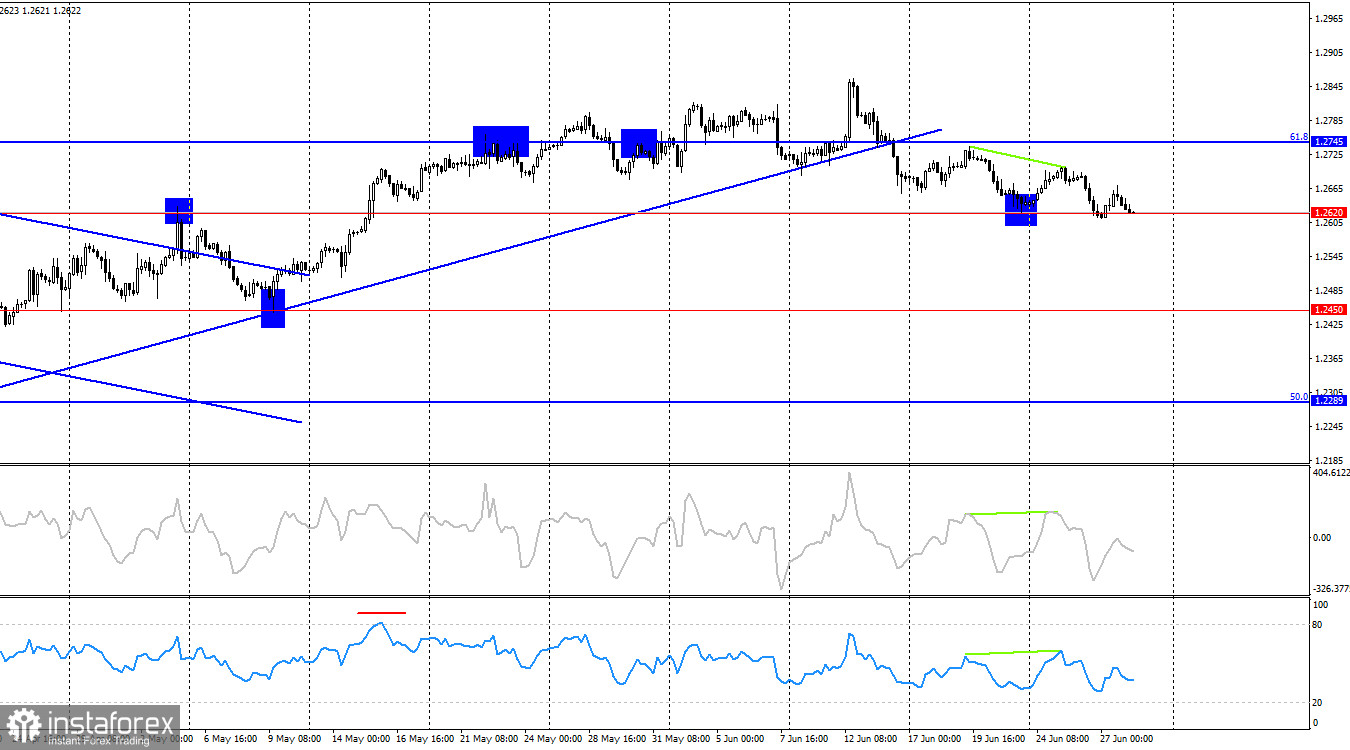
On the 4-hour chart, the pair reversed in favor of the US dollar and consolidated below the ascending trend line. After rebounding from the level of 1.2620, the British pound showed slight growth, but bearish divergence in CCI and RSI indicators suggests a reversal in favor of the US dollar and a resumption of the decline. If the pair's exchange rate remains below the level of 1.2620, it will increase the probability of further decline towards the next level at 1.2450.
Commitments of Traders (COT) report:

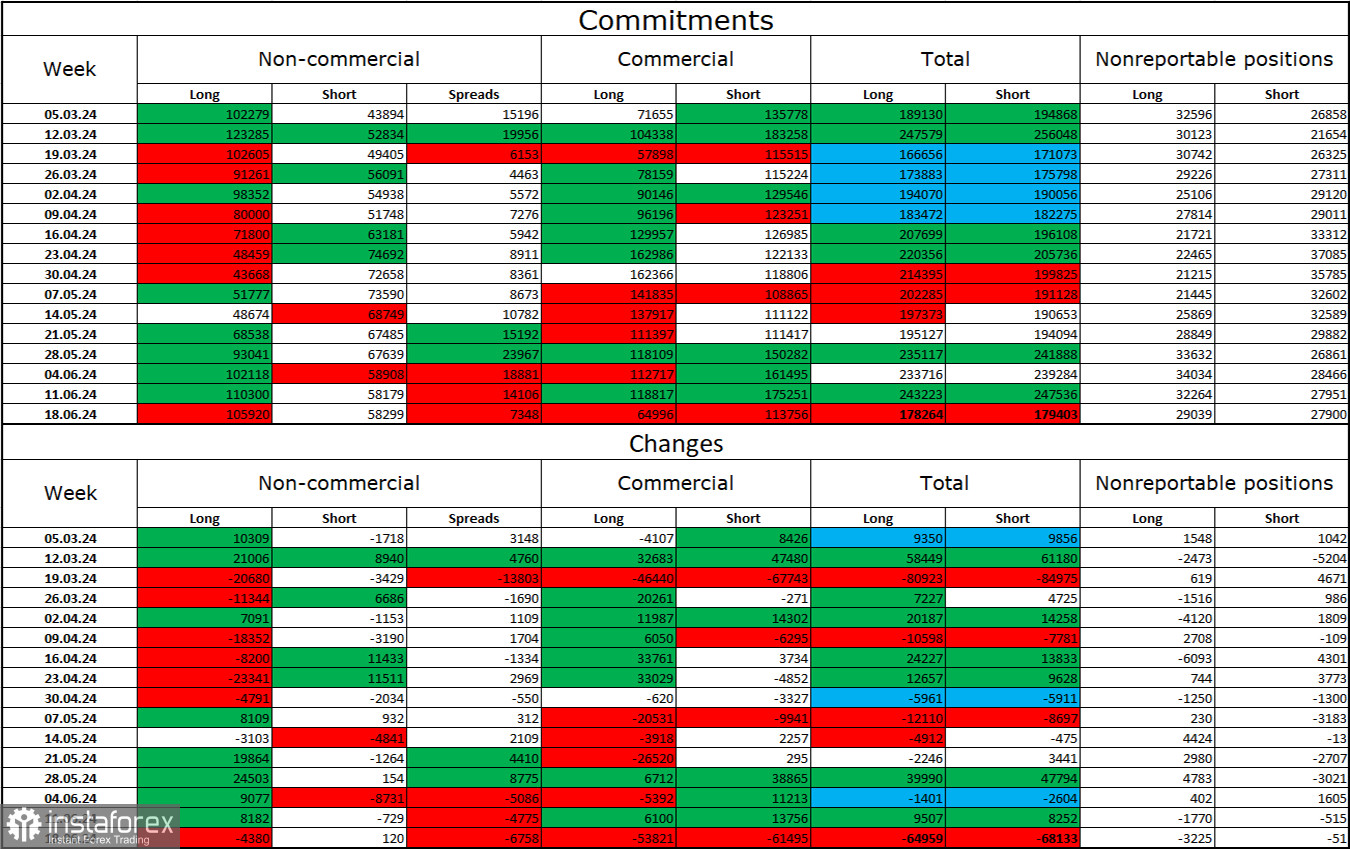
The sentiment among "Non-commercial" traders over the past reporting week has become slightly less bullish. The number of long positions held by speculators decreased by 4380 units, while the number of short positions increased by 120. Bulls maintain a significant advantage, with a gap between long and short positions amounting to 48 thousand: 106 thousand long positions versus 58 thousand short positions.
However, the British pound still retains excellent prospects for decline. Technical analysis has provided several signals of a break in the bullish trend, and bulls have been unable to sustain attacks consistently. Over the past 3 months, the number of long positions has increased from 102 thousand to 106 thousand, while short positions have risen from 44 thousand to 58 thousand. Over time, large players will continue to get rid of buy positions or increase sell positions, as all potential factors supporting the purchase of the British pound have already been exhausted.
News Calendar for the US and the UK:
United Kingdom:
- GDP for the first quarter (06:00 UTC).
United States:
- Core Personal Consumption Expenditures (PCE) Price Index (12:30 UTC).
- Personal Income and Spending (12:30 UTC).
- University of Michigan Consumer Sentiment Index (14:00 UTC).
The economic events calendar includes several important entries on Friday. The news background's influence on market sentiment today could be moderate in the second half of the day.
GBP/USD forecast and tips for traders:
The pound's sales are possible if it closes below 1.2611–1.2620, targeting 1.2565. Purchases on the hourly chart can be considered on a rebound from the 1.2611–1.2620 zone, targeting 1.2690–1.2705.
Fibonacci level grids are built from 1.2036 to 1.2892 on the hourly chart and from 1.4248 to 1.0404 on the 4-hour chart.
 English
 Русский
 Bahasa Indonesia
 Bahasa Malay
 ไทย
ไทย Español
 Deutsch
 Български
 Français
 Tiếng Việt
 中文
中文 বাংলা
বাংলা हिन्दी
 Čeština
 Українська
 Română

