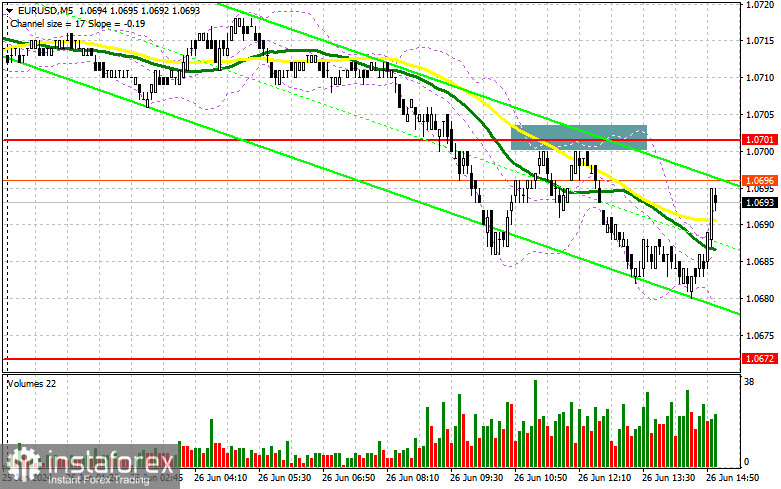
In my morning forecast, I pointed out the level of 1.0701 and planned to make trading decisions based on it. Let's look at the 5-minute chart and analyze what happened there. The breakout and retest of 1.0701 after weak German statistics led to entering short positions, resulting in a drop of the pair by 20 points, but we did not reach the target level of 1.0672. The technical outlook for the second half of the day remained unchanged.

To open long positions on EUR/USD, the following conditions are required:
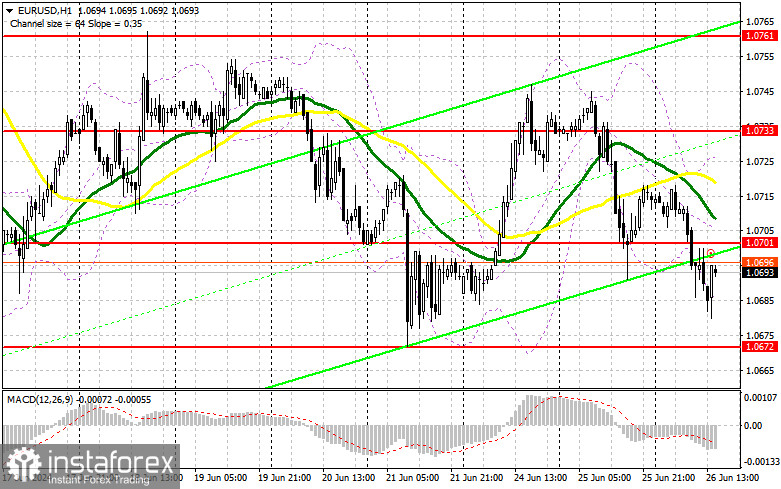
Weak data from Germany and dovish remarks from a European Central Bank representative have only increased pressure on the euro, which has struggled to grow for the second consecutive day. During the American session, data on new home sales in the US, although of interest to the market, are likely to see euro demand return if the figures match economists' forecasts. This is because there will likely be fewer sellers around the monthly minimum. Only a false breakout around 1.0672 would be a suitable entry point for long positions, targeting a retest of 1.0701—previously resistance acting as support earlier in the day.
Just above this level are the moving averages, favoring sellers. Therefore, a breakout and subsequent decline from this range will strengthen the pair with a chance to rise toward 1.0733. The ultimate target is the peak at 1.0761, where I will take profits. Testing this level will give buyers an advantage. If EUR/USD declines and there is no activity around 1.0672 in the second half of the day, sellers will take full control, breaking out of the sideways channel, which I consider less likely. In such a case, I will enter only after a false breakout around the next support at 1.0642. To enter long positions immediately on a rebound, I plan to start from 1.0601, targeting an upward correction of 30-35 points within the day.
To open short positions on EUR/USD, the following conditions are required:
Sellers have shown themselves quite well, and it is crucial now to stay below 1.0701. In the event of a bullish market reaction to US data, which cannot be ruled out, defending the resistance at 1.0701 and a false breakout there would provide a suitable entry point for short positions, aiming for further decline of the pair towards the support at 1.0672, which acts as a kind of lower boundary of the sideways channel. A breakout and consolidation below this range against the backdrop of strong US real estate market statistics, as well as a reverse test from below upwards, would provide another selling point with a move towards a new low of 1.0642, where I expect to see more active bullish behavior.
The ultimate target will be the minimum at 1.0601, where I will take profits. In case EUR/USD moves upwards in the second half of the day and if there are no bears at 1.0701, which is more likely, buyers may restore balance to the market, keeping trading within the channel. In this case, I will postpone selling until testing the next resistance at 1.0733. I will sell there as well, but only after an unsuccessful consolidation. I plan to open short positions immediately on a rebound from 1.0761, targeting a downward correction of 30-35 points.

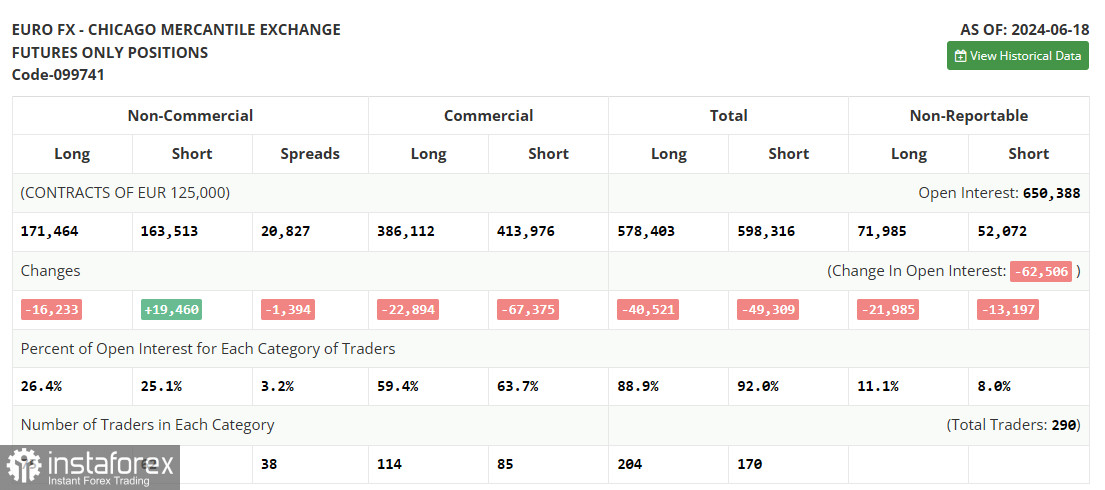
In the COT (Commitment of Traders) report for June 18, there was an increase in short positions and a reduction in long positions. The outcomes of the meetings of the Federal Reserve System and the European Central Bank were noticed, significantly affecting the market dynamics. The total number of short and long positions also confirms the current balance and equilibrium observed on the chart. Considering that no significant statistics are expected in the near future, this equilibrium will likely continue to persist. However, it should be understood that the overall trend and bearish direction of EUR/USD have not disappeared, and the euro's decline could continue at any moment. According to the COT report, non-commercial long positions decreased by 16,233 to 171,464, while non-commercial short positions increased by 19,460 to 163,513. As a result, the spread between long and short positions decreased by 1,394.
Indicator Signals:
Moving Averages
Trading is below the 30-day and 50-day moving averages, indicating a decline in the euro.
Note: The period and prices of the moving averages are considered by the author on the hourly chart (H1) and differ from the general definition of classic daily moving averages on the daily chart (D1).
Bollinger Bands
In case of a decline, the lower boundary of the indicator, around 1.0685, will act as support.
Description of Indicators:
• Moving average (smooths out volatility and noise to determine the current trend). Period - 50. Marked in yellow on the chart;
• Moving average (smooths out volatility and noise to determine the current trend). Period - 30. Marked in green on the chart;
• MACD indicator (Moving Average Convergence/Divergence). Fast EMA - period 12. Slow EMA - period 26. SMA - period 9;
• Bollinger Bands. Period - 20;
• Non-commercial traders - speculators, including individual traders, hedge funds, and large institutions using the futures market for speculative purposes and meeting certain requirements;
• Long non-commercial positions represent the total long open position of non-commercial traders;
• Short non-commercial positions represent the total short open position of non-commercial traders;
• Total non-commercial net position is the difference between short and long positions of non-commercial traders.
 English
 Русский
 Bahasa Indonesia
 Bahasa Malay
 ไทย
ไทย Español
 Deutsch
 Български
 Français
 Tiếng Việt
 中文
中文 বাংলা
বাংলা हिन्दी
 Čeština
 Українська
 Română

