EUR/USD

Higher timeframes
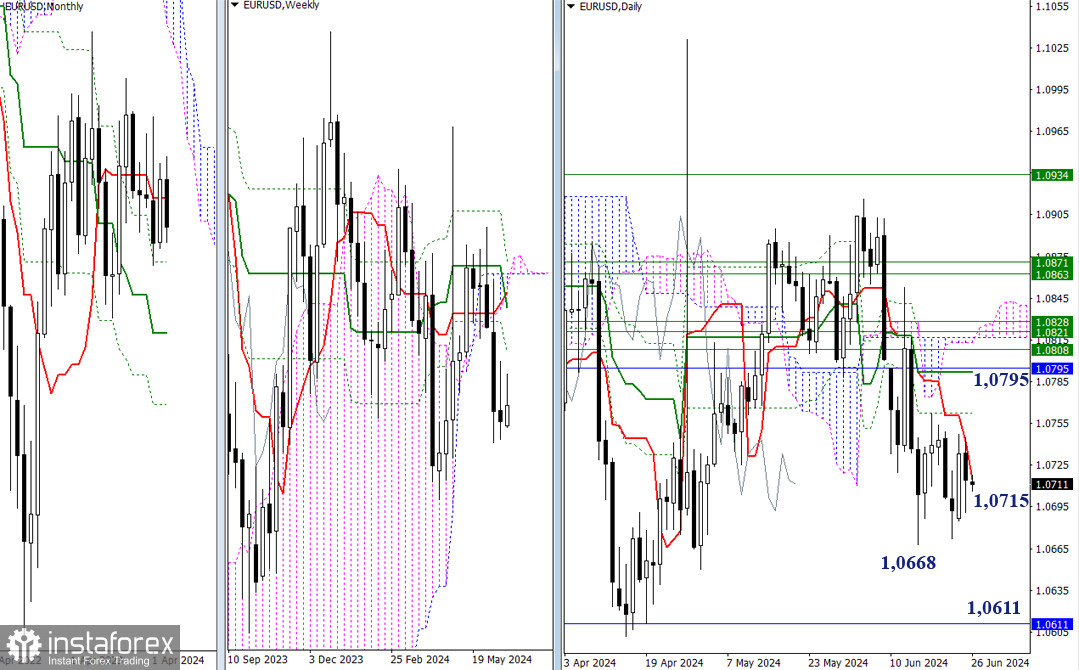
The pair is showing uncertainty and progress in consolidation. In the current conditions, in order for the bears to continue the intraday downtrend, they need to test the low (1.0668) of the current correction and consolidation. After that, they will face monthly support at 1.0611. In turn, the bulls need to regain the daily short-term trend (1.0715) and continue to climb towards other resistances of the daily Ichimoku cross. Today, the nearest levels of the daily cross are located at 1.0763 and 1.0792, reinforced by the monthly short-term trend (1.0795).

H4 – H1
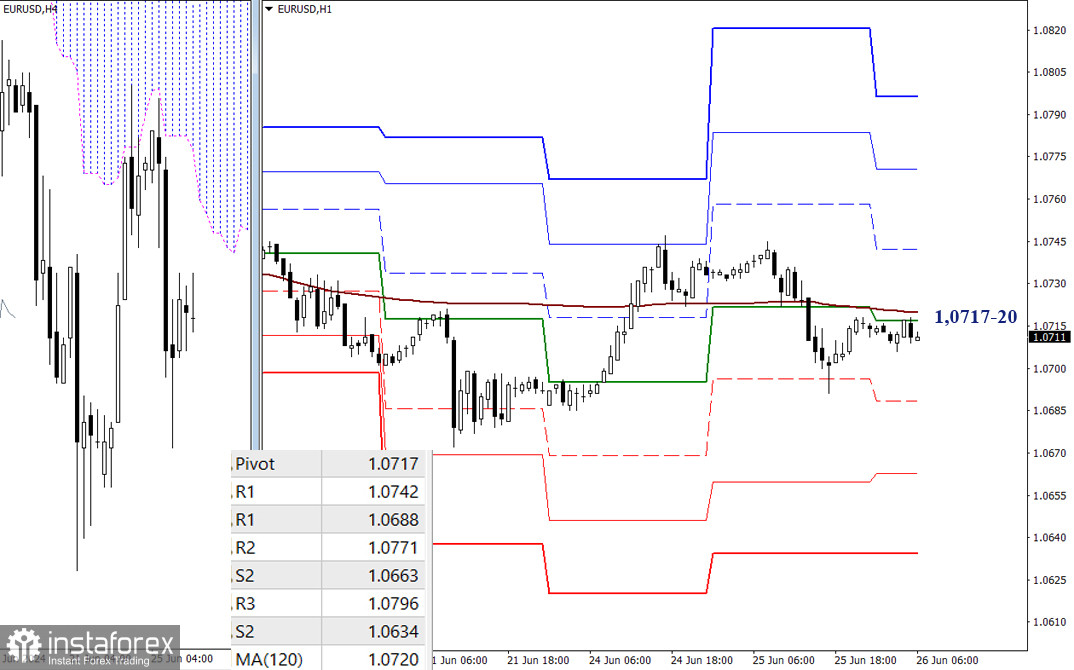
On the lower timeframes, the pair has descended below the key levels, which have almost merged around 1.0717-20 (the central Pivot level of the day + the weekly long-term trend), but we have not seen progress yet, as the market continues to trade in an area of key levels. If traders become active today, the bears will develop a direct movement through passing the supports of the classic Pivot levels (1.0688 – 1.0663 – 1.0634), while the bulls, after reclaiming the key levels on their side, will aim for the resistances of the classic Pivot levels (1.0742 – 1.0771 – 1.0796).
***
GBP/USD

Higher timeframes
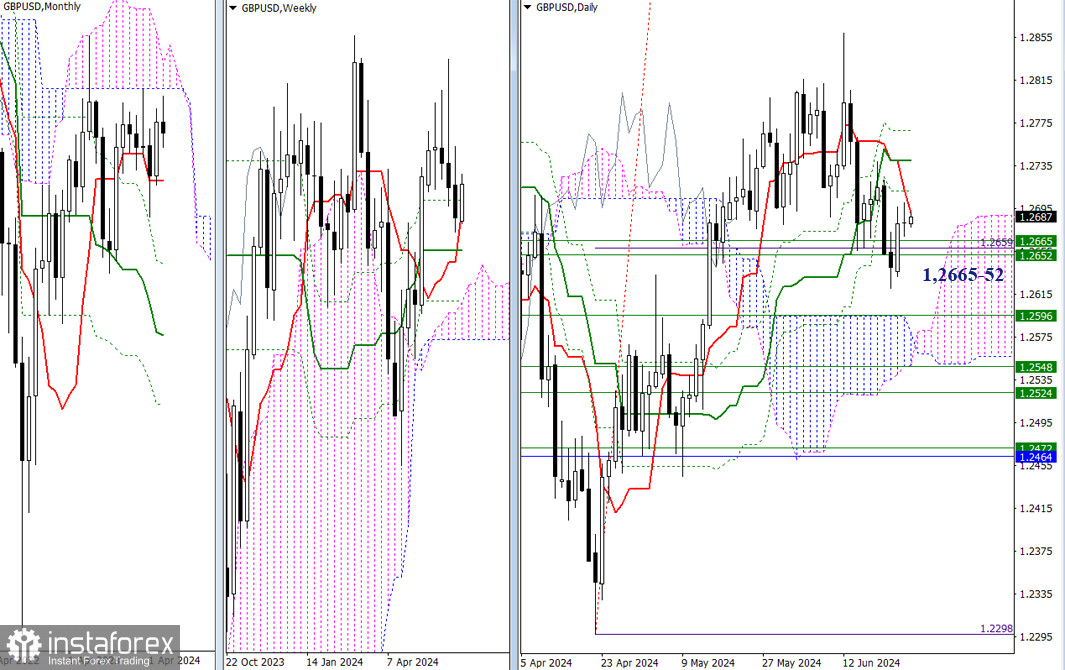
Yesterday, trading ended with a small candle of uncertainty, indicating that the market is pondering its next move. The bulls must eliminate the daily Ichimoku dead cross (1.2692 – 1.2712 – 1.2740 – 1.2768). For the bears, the first step is to descend below the weekly supports (1.2652-65) and test the nearest low (1.2621). Then they will direct their attention towards a decline to the support levels, with the first support being around the level of 1.2596 (weekly mid-term trend).

H4 – H1
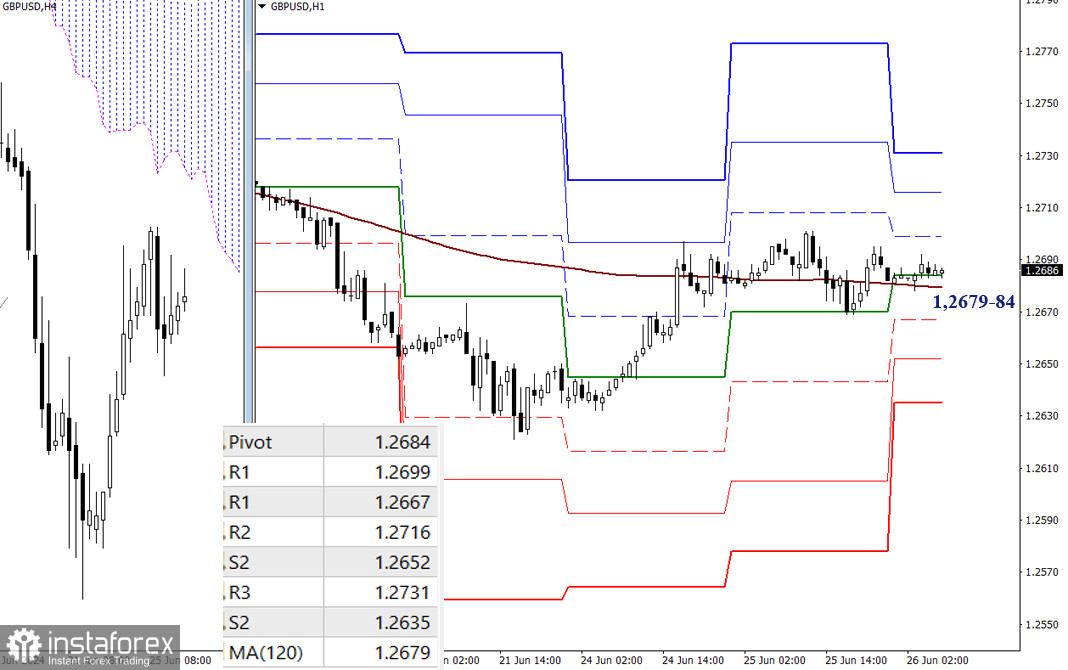
On the lower timeframes, the market remains attached to key levels at 1.2679-84 (central Pivot level + weekly long-term trend). The bulls have a slight advantage since the pair has settled above the weekly trend (1.2679). Developments may bring back the relevance of the main benchmarks of the lower time frames – the classic Pivot levels. Significant resistance levels for the bulls are found at (1.2699 – 1.2716 – 1.2731), while for the bears, the important supports are located at (1.2667 – 1.2652 – 1.2635).
***
The technical analysis of the situation uses:
Higher timeframes - Ichimoku Kinko Hyo (9.26.52) + Fibonacci Kijun levels
Lower timeframes - H1 - Pivot Points (classic) + Moving Average 120 (weekly long-term trend)
 English
 Русский
 Bahasa Indonesia
 Bahasa Malay
 ไทย
ไทย Español
 Deutsch
 Български
 Français
 Tiếng Việt
 中文
中文 বাংলা
বাংলা हिन्दी
 Čeština
 Українська
 Română

