USD/JPY
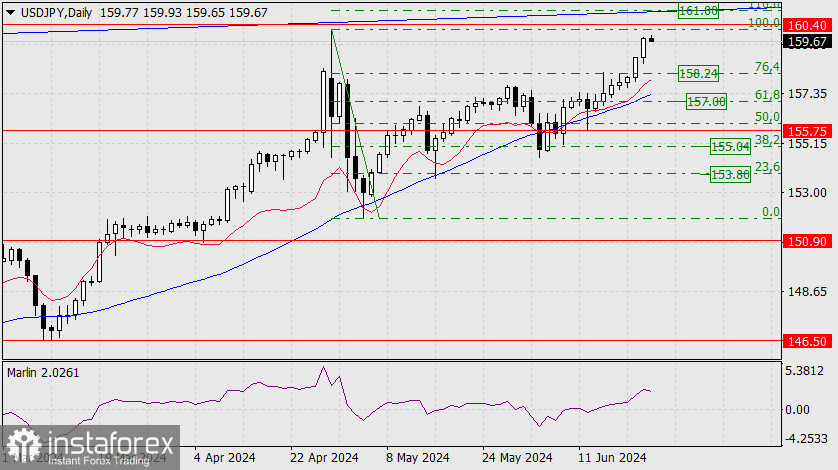
The dollar repeated its pattern of impulsive growth from Thursday, as it jumped by 86 pips on Friday. The target level of 160.40 is already close, and it exceeds the high on April 29th. Next, the target mark of 161.00 is visible - the point where the upper boundary of the price channel coincides with the Fibonacci level of 110.0%.

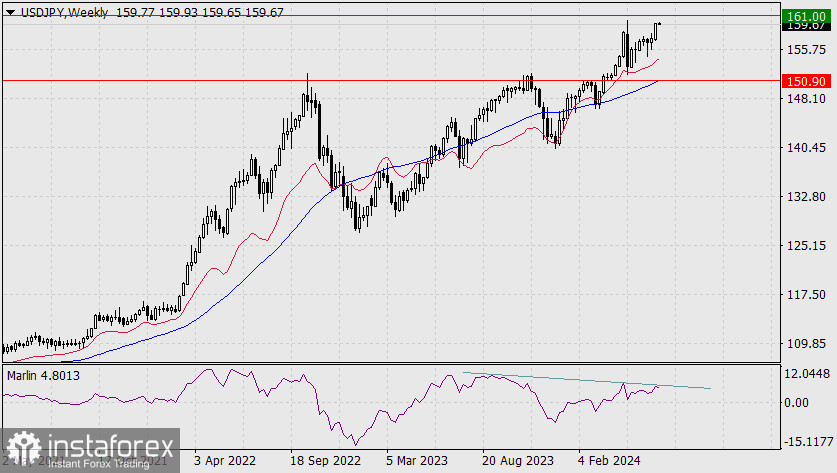
We are expecting a price reversal from one of these target levels. A triple divergence with the Marlin oscillator will form amid such a reversal on the weekly scale.

The Marlin oscillator shows the beginning of a reversal, which is already a sign that the price may not even reach the level of 160.40. In this scenario, we can confirm the reversal when the price moves below the Fibonacci level of 76.4% (158.24). If the price reaches 161.00, a decline may occur if it moves below 160.40.

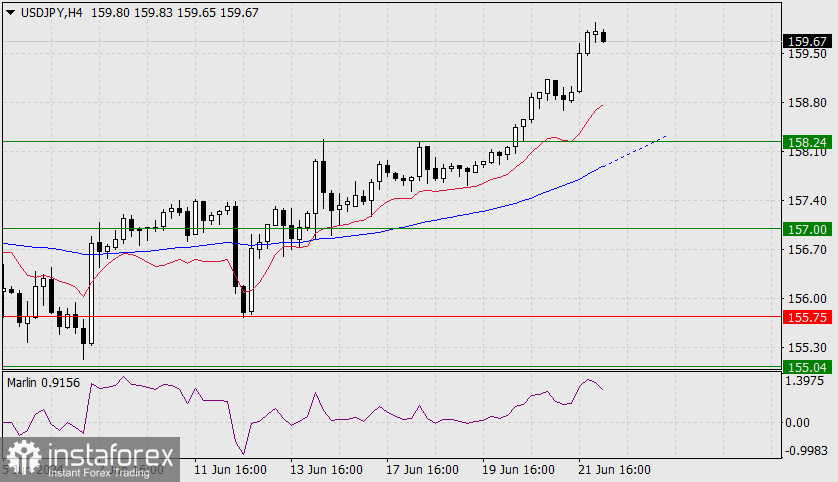
The price and the oscillator are turning downwards on the 4-hour chart. The signal is weak but may grow stronger over time. The MACD line is approaching the level of 158.24, reinforcing the support. If the price surpasses this mark, this could fuel the decline. Take note that on the daily chart, the MACD line is approaching the level of 158.24. We await further clarity in the situation.
 English
 Русский
 Bahasa Indonesia
 Bahasa Malay
 ไทย
ไทย Español
 Deutsch
 Български
 Français
 Tiếng Việt
 中文
中文 বাংলা
বাংলা हिन्दी
 Čeština
 Українська
 Română

