Analysis of GBP/USD 5M

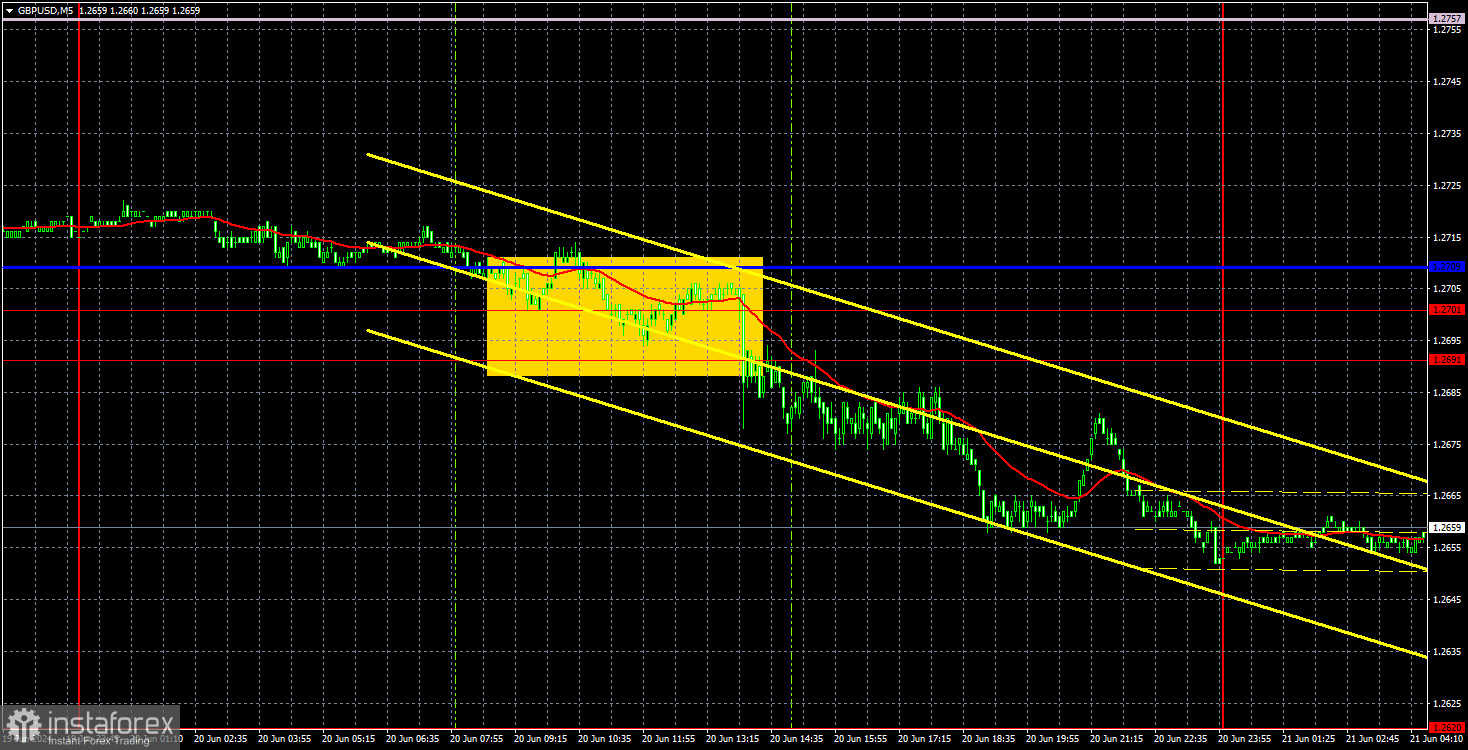
GBP/USD went through a challenging phase on Thursday. The pair has shown extremely confusing movements over the past six months. It trades in a similar pattern every day. In general, we can conduct analysis on the pound, draw certain conclusions, and trade in the opposite direction, as fundamentals and macroeconomics have no influence on the pair's movements. There were two important days for the British currency this week. The pair rose 35 pips on Wednesday, as the UK Consumer Price Index fell to 2% (the Bank of England's target level). The next day, the pound lost 50 pips on the results of the Bank of England meeting, which can be considered hawkish. In both cases, volatility left much to be desired. In both cases, even intraday movements were similar.
Just to remind you, in the event that inflation falls (especially to the target level), the central bank has the opportunity to begin easing monetary policy, and this should exert pressure on the national currency, causing it to depreciate. However, if the central bank maintains a hawkish policy, when it would be more logical to ease (at least in the central bank's sentiment), the national currency has every chance to strengthen. On Wednesday and Thursday, we saw a weak and yet opposite market reaction. Formally, it can be assumed that the pound has turned downward, as the 4-hour timeframe showed that the price has been below the moving average for several consecutive days. However, there is currently a 50-50 probability of a downward trend.
One trading signal was generated on the 5-minute timeframe. During the European trading session, the pair crossed the Kijun-sen line and the range of 1.2691-1.2701, so traders could open short positions. By the end of the day, the pound barely fell, by a "whopping" 30 pips, which traders could have taken as profit from this trade.
COT report:

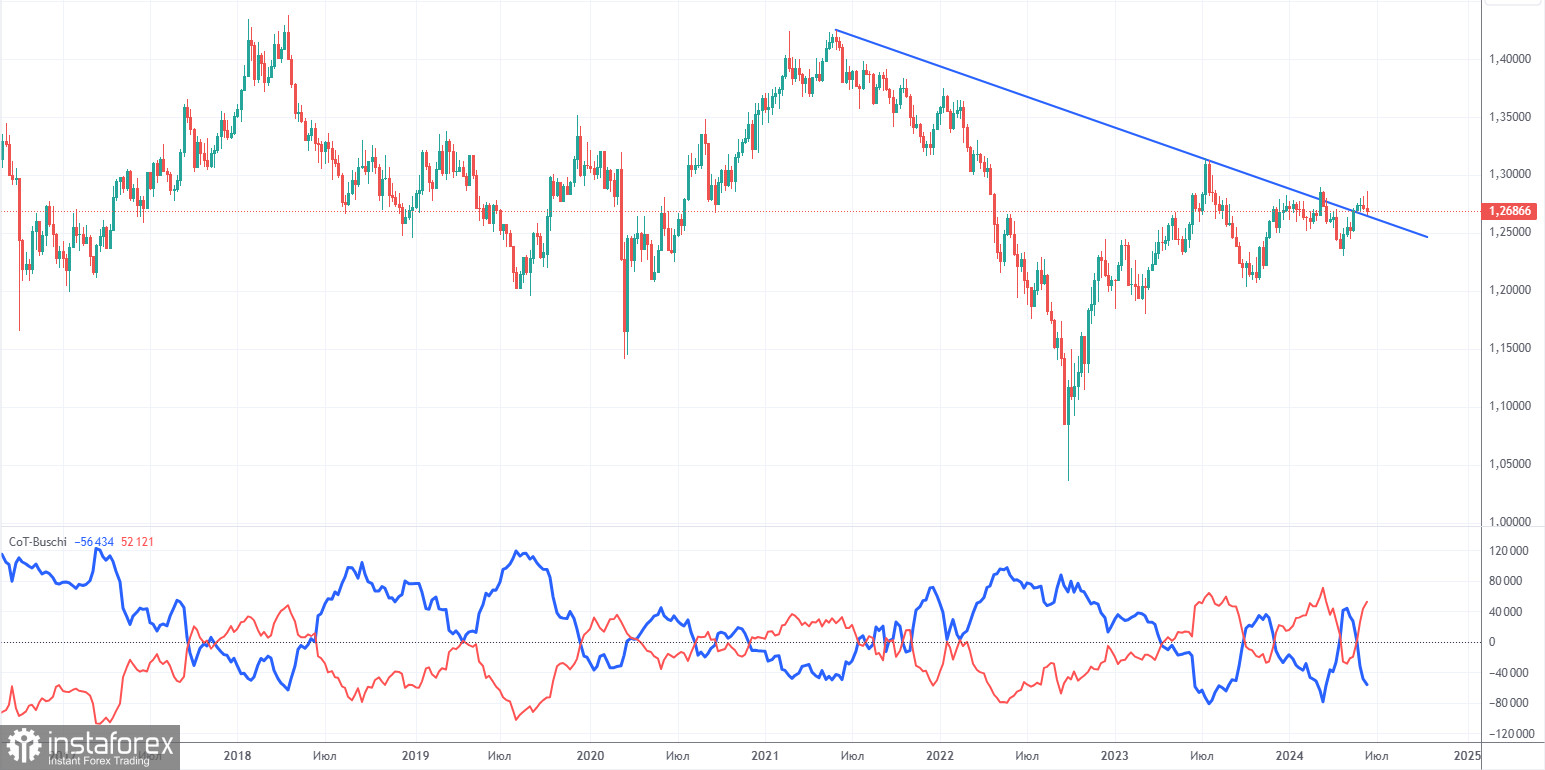
COT reports on the British pound show that the sentiment of commercial traders has frequently changed in recent years. The red and blue lines, which represent the net positions of commercial and non-commercial traders, constantly intersect and generally remain close to the zero mark. According to the latest report on the British pound, the non-commercial group opened 8,100 buy contracts and closed 700 short ones. As a result, the net position of non-commercial traders increased by 8,800 contracts over the week, which is quite significant for the pound. Thus, sellers failed to seize the initiative at the most critical moment.
The fundamental background still does not provide a basis for long-term purchases of the pound sterling, and the currency has a good chance to resume the global downward trend. However, the price has already breached the trend line on the 24-hour timeframe at least twice. The level of 1.2765 is currently preventing the pound from rising further.
The non-commercial group currently has a total of 110,300 buy contracts and 58,200 sell contracts. The bulls have taken the initiative, but aside from the COT reports, there is nothing else that suggests a potential rise in the GBP/USD pair.
Analysis of GBP/USD 1H

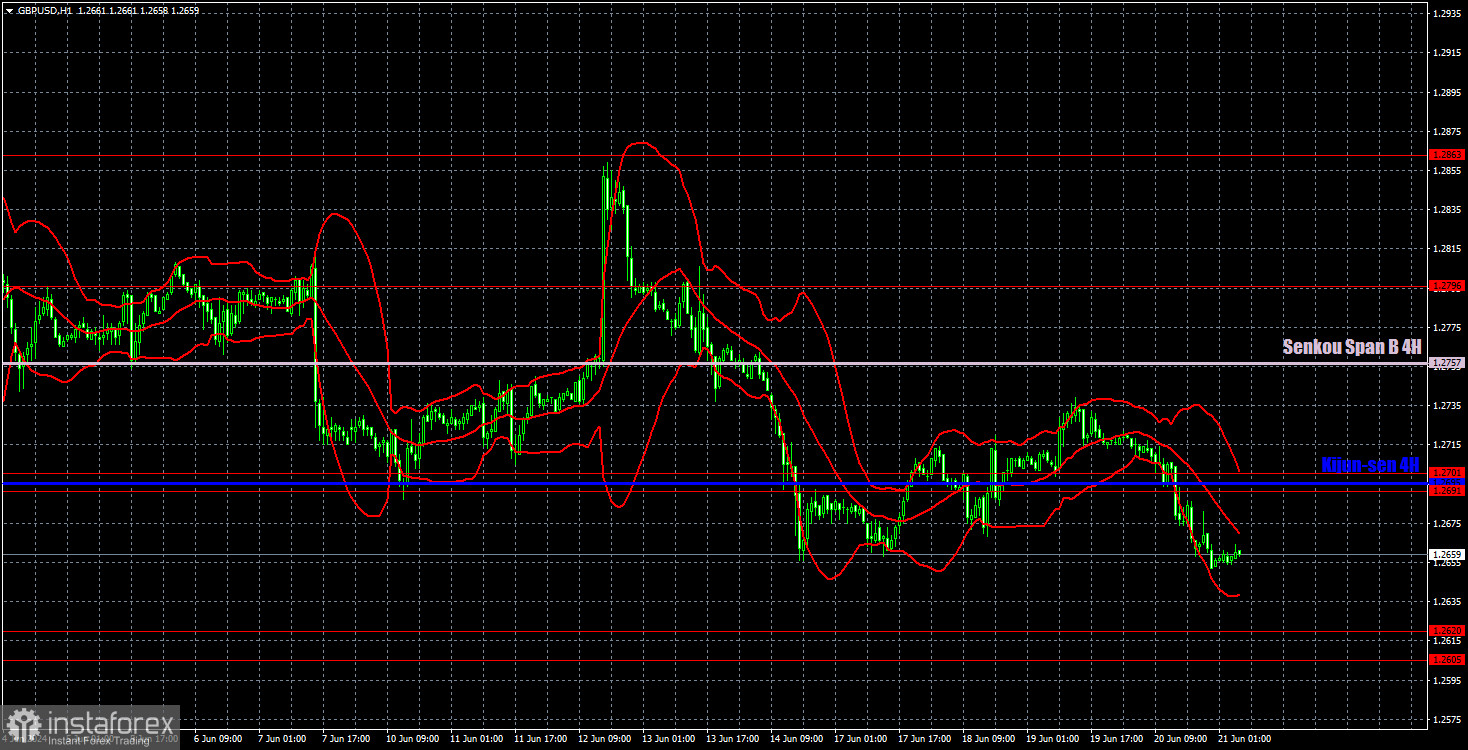
On the 1H chart, GBP/USD tried to start a new downward movement, but it appears that this attempt will end very quickly, as has happened numerous times before. The price may consolidate above the 1.2691-1.2701 area for the second time, but at the moment, the most important thing for a downward move is missing – a firm bearish bias. The pound is moving down once again, as if doing someone a favor.
As of June 21, we highlight the following important levels: 1.2215, 1.2269, 1.2349, 1.2429-1.2445, 1.2516, 1.2605-1.2620, 1.2691-1.2701, 1 ,2796, 1.2863, 1.2981-1.2987. The Senkou Span B (1.2757) and Kijun-sen (1.2695) lines can also serve as sources of signals. Don't forget to set a Stop Loss to breakeven if the price has moved in the intended direction by 20 pips. The Ichimoku indicator lines may move during the day, so this should be taken into account when determining trading signals.
On Friday, the UK and the US will publish business activity indices for the services and manufacturing sectors. These are not crucial indicators. They may trigger a market reaction of 20-30 pips at most. The current volatility of the pair is very weak. The pound may continue to fall today, but intraday movements will likely remain sluggish.
Description of the chart:
Support and resistance levels are thick red lines near which the trend may end. They do not provide trading signals;
The Kijun-sen and Senkou Span B lines are the lines of the Ichimoku indicator, plotted to the 1H timeframe from the 4H one. They provide trading signals;
Extreme levels are thin red lines from which the price bounced earlier. They provide trading signals;
Yellow lines are trend lines, trend channels, and any other technical patterns;
Indicator 1 on the COT charts is the net position size for each category of traders;
 English
 Русский
 Bahasa Indonesia
 Bahasa Malay
 ไทย
ไทย Español
 Deutsch
 Български
 Français
 Tiếng Việt
 中文
中文 বাংলা
বাংলা हिन्दी
 Čeština
 Українська
 Română

