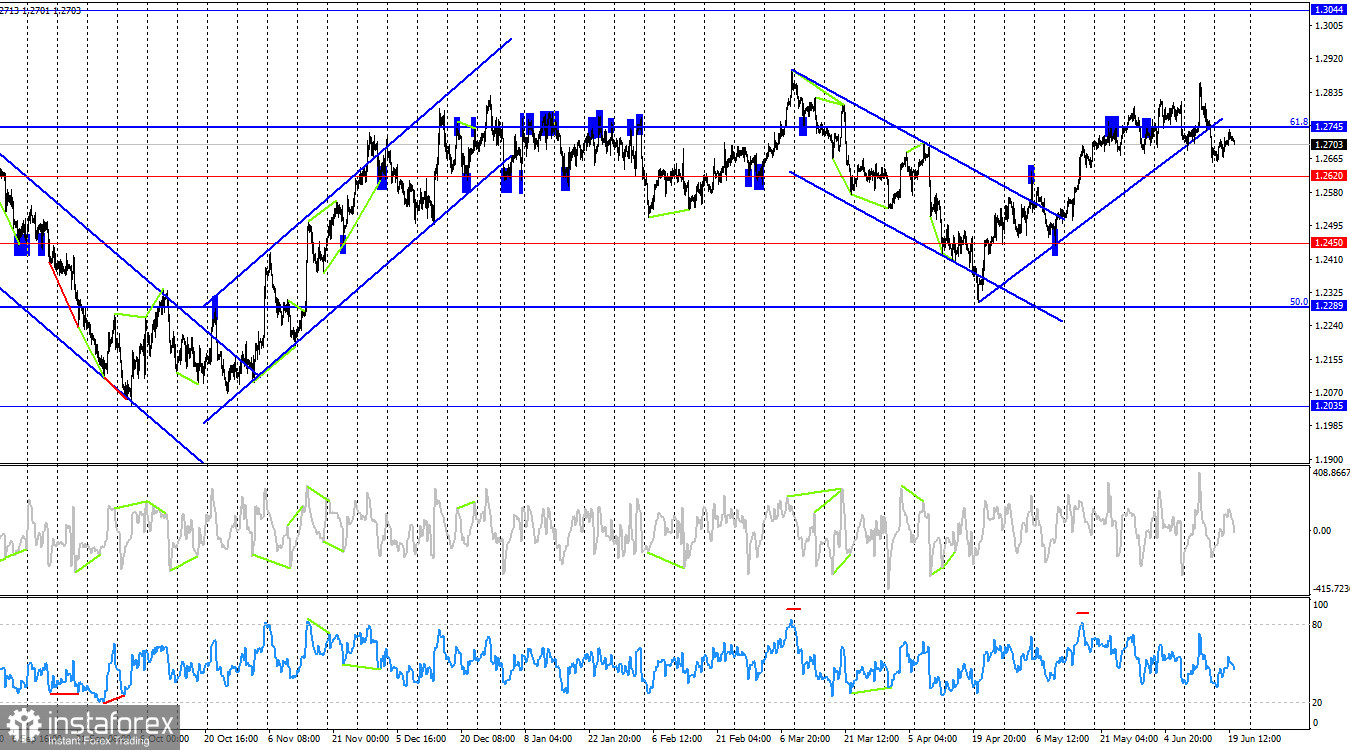
The GBP/USD pair has been trading quite oddly over the past few months. A significant drop is imminent, as the price has been stuck in the same zone for too long. I zoomed out the 4-hour chart to clearly show how much time the pair has spent between the levels of 1.2300 and 1.2850. Currently, it has been seven months. Since any sideways trend tends to conclude with the beginning of a new trend, traders have been anticipating this new trend for several months. The question is, what will it be?

Arguments for a New Downtrend
There are many arguments in favor of a new downtrend:
- The drop in UK inflation to 2%.
- The weakness of the British economy.
- The likely imminent easing of monetary policy by the Bank of England.
- The Federal Reserve's inability to lower interest rates in the coming months.
- The strength and stability of the US economy.
80% of the informational background points to a new rise in the US dollar. So why has the pound yet to start a new bearish trend?
There is currently a process of liquidity pull. Since most of the market is expecting a drop in the pound, larger players are pulling liquidity located above recent peaks, such as those from December 28 and March 8. Liquidity has been pulled twice, and it could happen a third time in the coming weeks. After that, the chances of forming a new bearish trend will increase even further. However, this is just my opinion.
Arguments for an Uptrend
The strength of the bulls. Bulls continue to attack regularly, which is especially noticeable on higher timeframes. There are no other arguments. Nevertheless, this factor alone may continue to push the pound sterling up for some time. For example, a break above the March 8 peak would indicate another liquidity pull.
Yesterday, the inflation report showed a decrease of 2%. There can only be one conclusion: the Bank of England will start easing monetary policy in the near future. In this case, the informational background will become even more bearish. Thus, we only need to wait for large players to collect all the liquidity above recent peaks, after which the pound may start falling below the level of 1.2300.
Conclusion
The trend for the GBP/USD pair has yet to turn bearish. However, the longer the pound rises, the more I question the justification for this movement. The informational background has been pointing to a bearish movement for several months. From a graphical point of view, a bearish trend is also possible. However, the pair constantly strives towards its recent peaks and breaks through them. This could be a precursor to a reversal and a significant drop, which the informational background would fully support.
The peak from March 8 has not yet been broken, so the bulls may make another attempt to pull liquidity from the last peak. All of the above is merely a hypothesis. However, this hypothesis is becoming increasingly convincing with each passing day. If it is correct, then the potential drop for the pound is at least 500 points. However, good entry points are needed on lower timeframes. One such point already exists – a close below the 1.2690-1.2705 zone on the seventh attempt. Currently, a corrective bullish wave is forming, and after its completion, the pound may start the long-awaited decline.
 English
 Русский
 Bahasa Indonesia
 Bahasa Malay
 ไทย
ไทย Español
 Deutsch
 Български
 Français
 Tiếng Việt
 中文
中文 বাংলা
বাংলা हिन्दी
 Čeština
 Українська
 Română

