 English
  Русский
 Bahasa Indonesia
 Bahasa Malay
 ไทย
ไทย Español
 Deutsch
 Български
 Français
 Tiếng Việt
 中文
中文 বাংলা
বাংলা हिन्दी
 Čeština
 Українська
 Română

EUR/USD
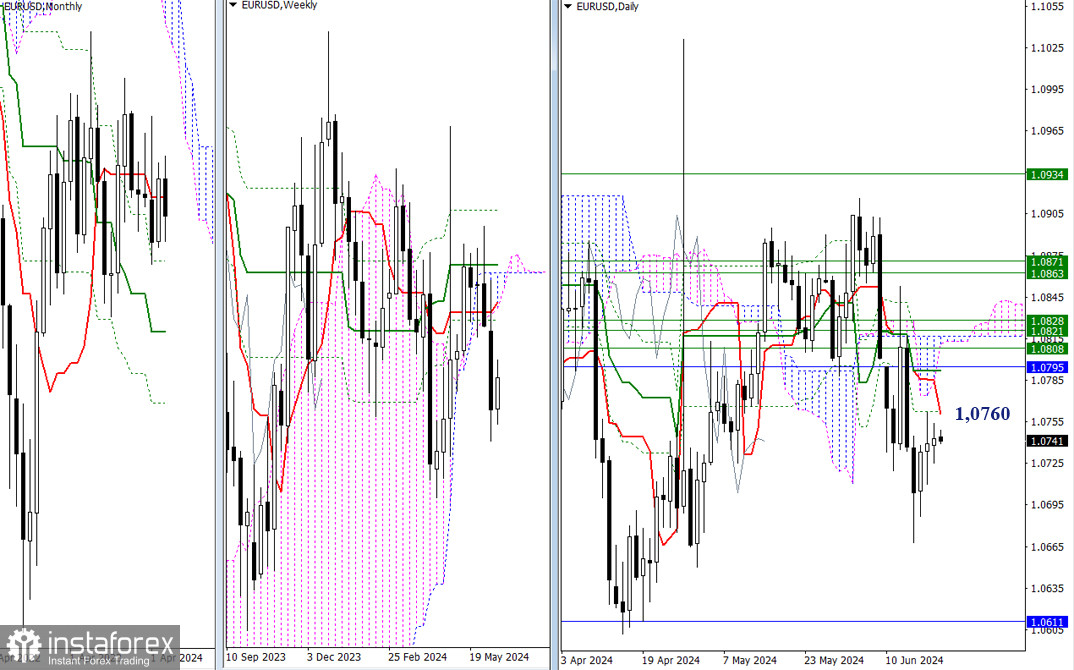
Higher timeframes
Yesterday, EUR/USD did not go through any significant changes and has not made any progress. Uncertainty persists in the market. The daily short-term trend has become the nearest resistance today (1.0760), followed by the resistances of the daily medium-term trend (1.0792) and the monthly short-term trend (1.0795), maintaining their significance and positions. For the bears, it is still important to test the low (1.0668) and push the pair towards the monthly support at 1.0611.
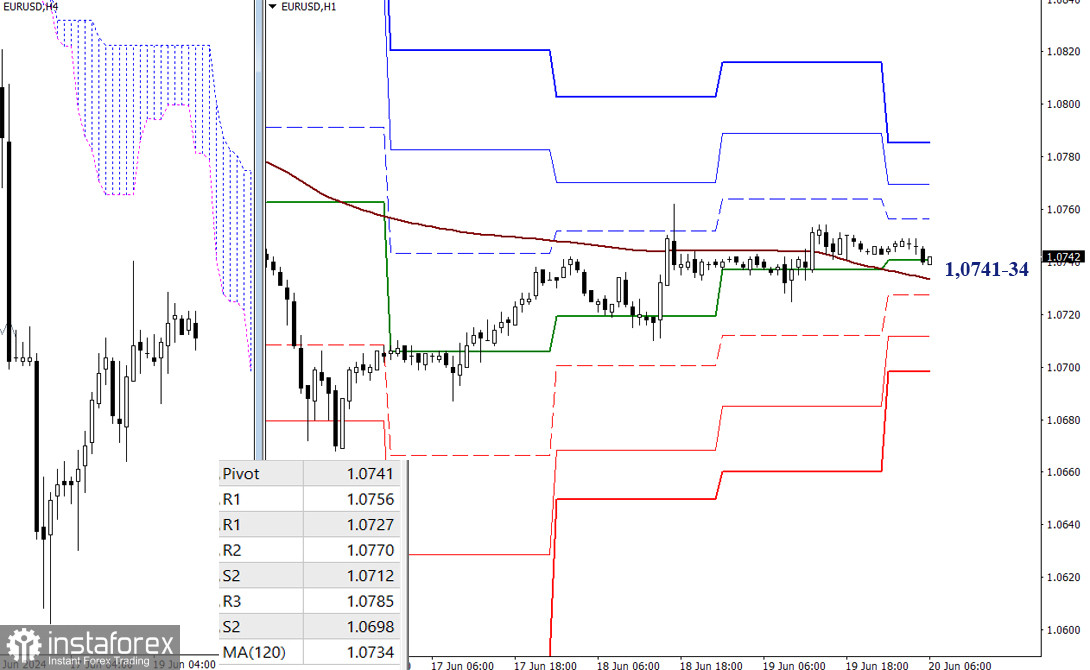
H4 – H1
On the lower timeframes, the bulls have taken control of key levels and settled higher, gaining support and a strategic advantage. If the pair continues to move upwards during the intraday session, the focus will be on the resistances of the classic Pivot levels (1.0756 - 1.0770 - 1.0785). In case of bearish activity, the focus will shift to the supports of the classic Pivot levels (1.0727 - 1.0712 - 1.0698).
***
GBP/USD
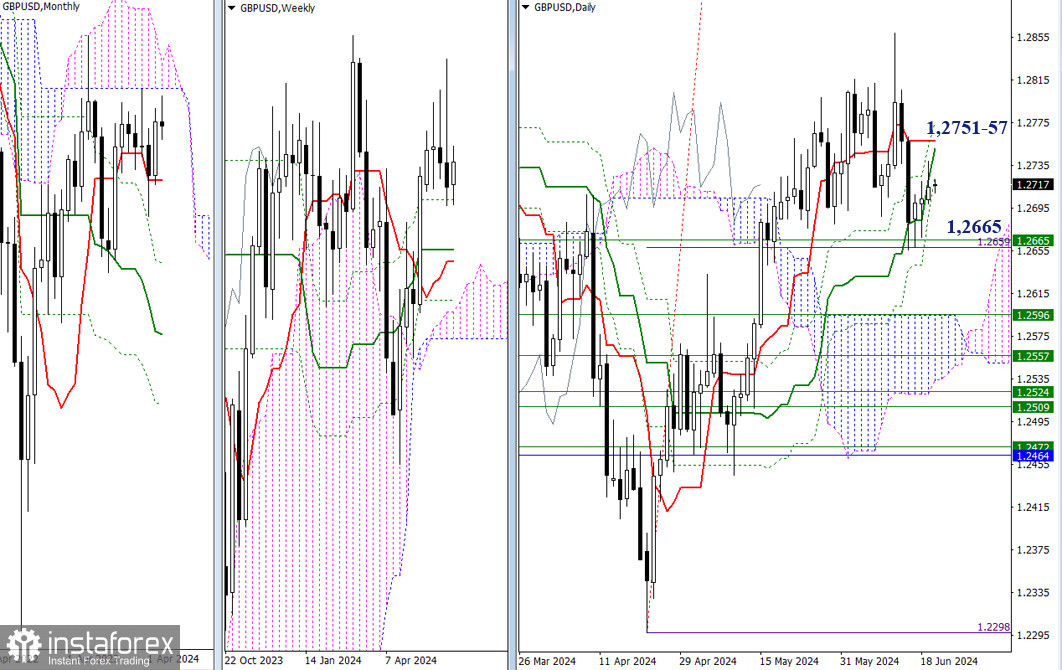
Higher timeframes
Today, the market continues to work above the weekly support (1.2665). As a result, this level serves as the main boundary that can influence further development of the situation. In the current conditions, the bullish bias may face resistance from the daily Ichimoku cross levels, converging around 1.2751 - 1.2757. Overcoming these resistances will open up new bullish prospects.
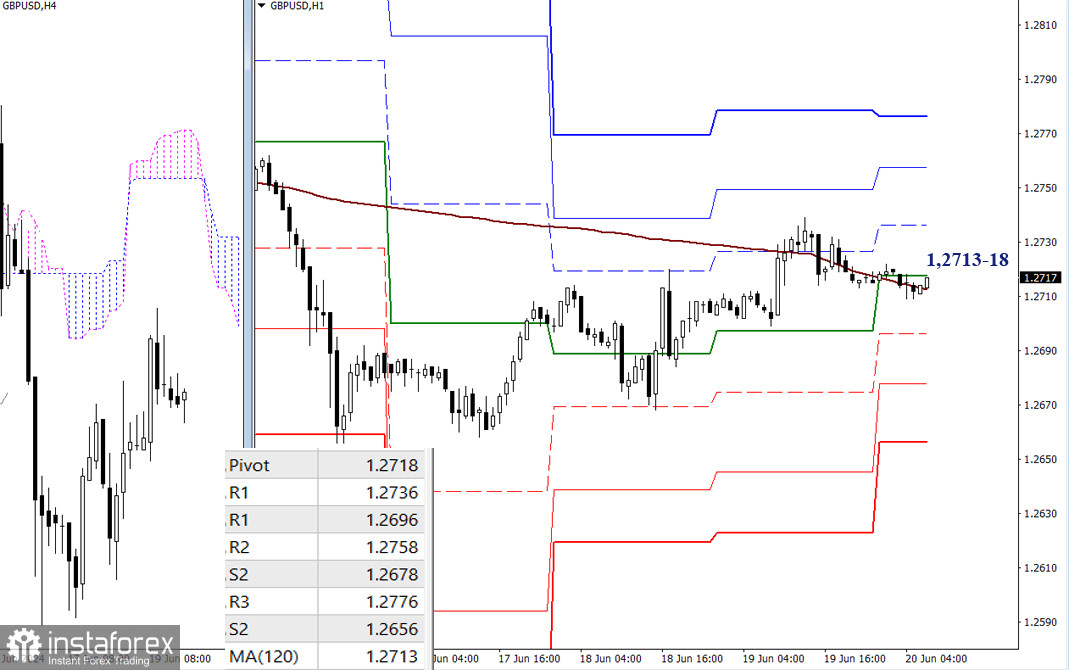
H4 – H1
Uncertainty prevails on the lower timeframes. The market is under the influence of key levels, which converge around 1.2713 - 1.2718 (weekly long-term trend + central Pivot level of the day). As the pair's movement unfolds, the focus will turn to resistances (1.2736 - 1.2758 - 1.2776) or supports (1.2696 - 1.2678 - 1.2656) of the classic Pivot levels.
***
The technical analysis of the situation uses:
Higher timeframes - Ichimoku Kinko Hyo (9.26.52) + Fibonacci Kijun levels
Lower timeframes - H1 - Pivot Points (classic) + Moving Average 120 (weekly long-term trend)