 English
  Русский
 Bahasa Indonesia
 Bahasa Malay
 ไทย
ไทย Español
 Deutsch
 Български
 Français
 Tiếng Việt
 中文
中文 বাংলা
বাংলা हिन्दी
 Čeština
 Українська
 Română

USD/JPY
The dollar continues to consolidate against the yen, facing resistance at 158.24, set by the 76.4% Fibonacci level. A break above this level opens the target of 160.40. However, the main scenario suggests that the price will fall to the 61.8% Fibonacci level (157.00), consolidate below it, and drop further to 155.75.
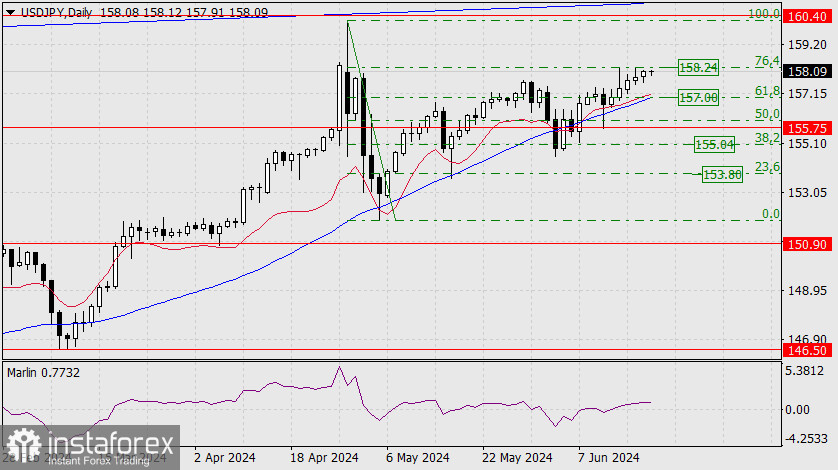
For this to happen, the market must broadly move away from risk, implying a decline in the U.S. stock market as well as other trading instruments. If the USD/JPY pair is waiting for this, it has about 3-4 days before the Kijun-sen line closely approaches the price. If the stock market decline drags on, the USD/JPY pair might gradually advance towards the indicated target.
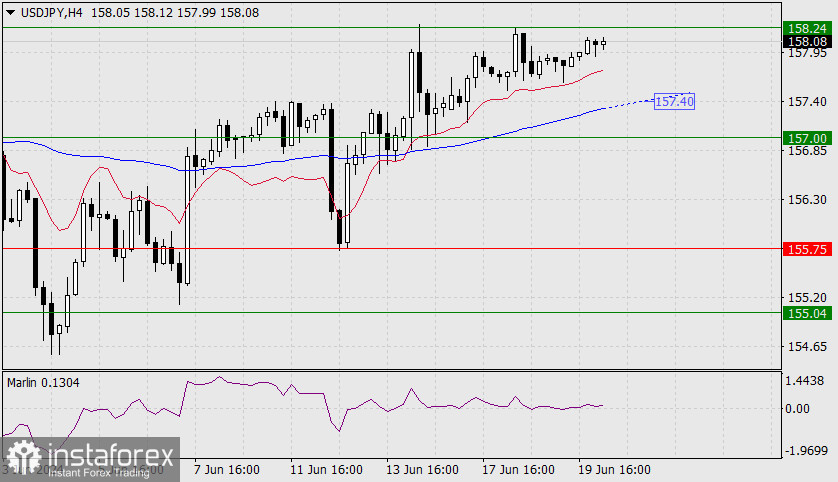
On the 4-hour chart, the signal line of the Marlin oscillator is moving sideways along the zero line. The price is consolidating above the indicator lines. The first sign of a potential bearish breakthrough is when the price overcomes the support of the Kijun-sen line (157.40).