EUR/USD

Higher timeframes
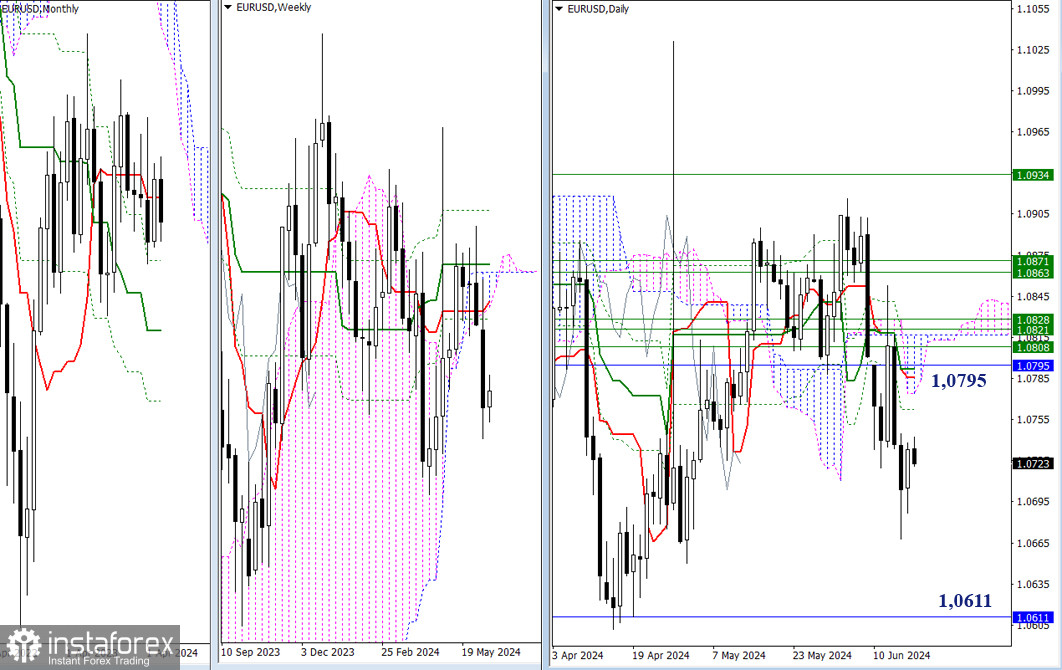
Monday was marked with a corrective slowdown. It will become clear in the coming days whether this movement will pick up and develop into a full daily correction. The next targets for the corrective movement are the resistances of the Ichimoku daily cross (1.0763 – 1.0785 – 1.0792), strengthened by the monthly trend in the short-term (1.0795). The end of the correction and the start of a downward movement will make bearish targets relevant again: the low (1.0602) and the monthly support (1.0611).

H4 – H1
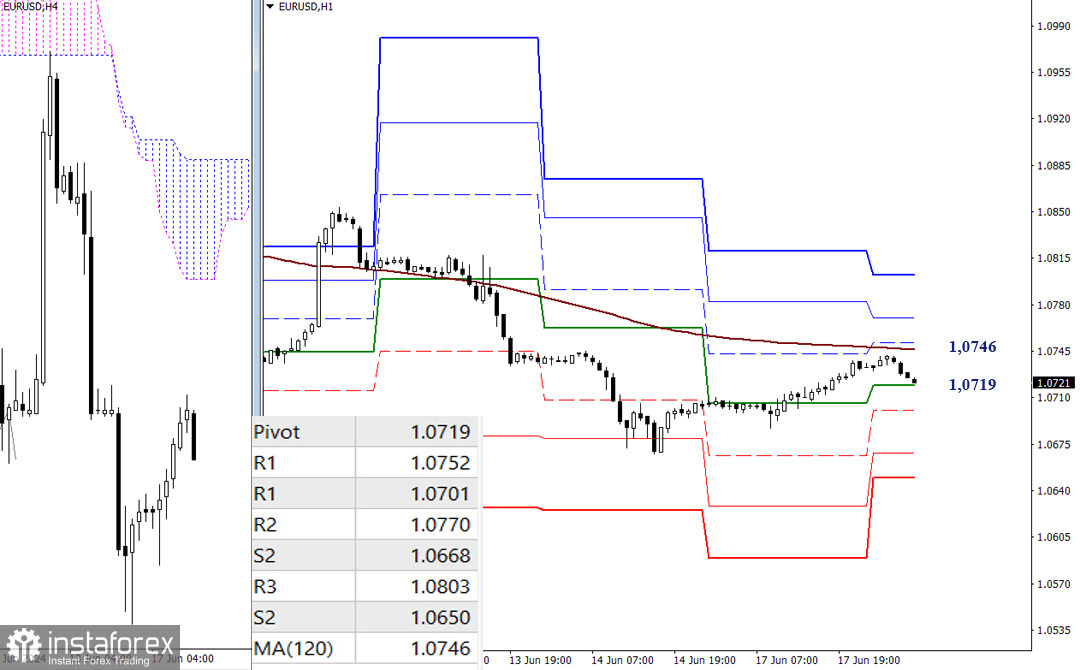
The lower timeframes show a moment of interaction with key levels 1.0719 (central Pivot level of the day) and 1.0746 (weekly long-term trend). Holding these levels can determine the current advantage. Trading below the key levels may strengthen the bearish bias, with intraday targets found at the supports of the classic Pivot levels (1.0701 – 1.0668 – 1.0650). Consolidating above and reversing the moving average will support the bullish sentiment, with targets at the resistances of the classic Pivot levels (1.0752 – 1.0770 – 1.0803).
***
GBP/USD

Higher timeframes
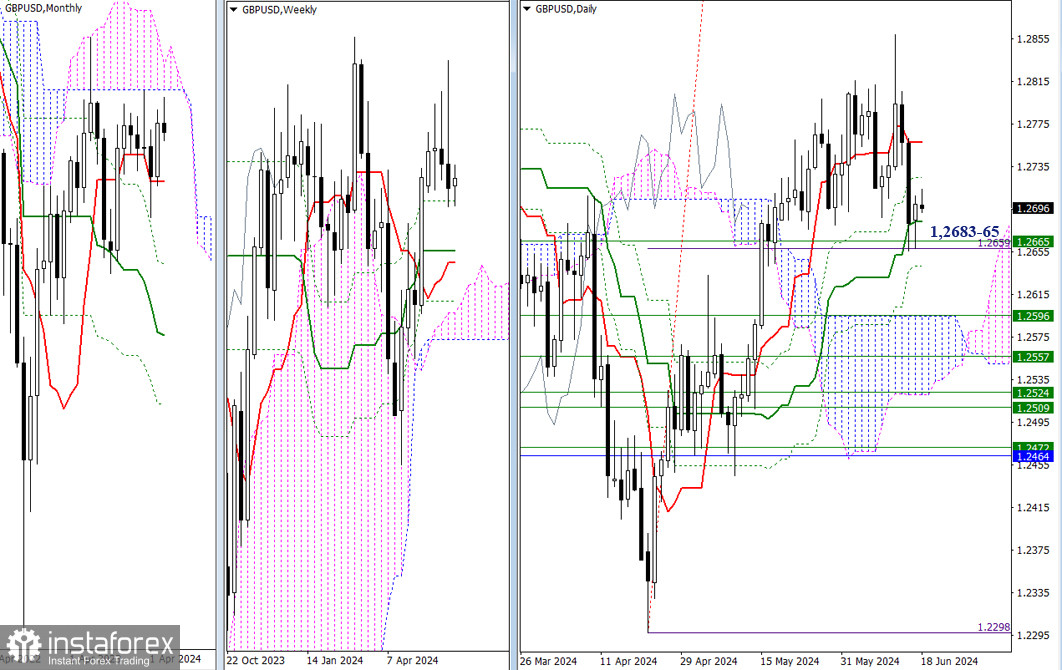
The supports around 1.2683 (daily mid-term trend) and 1.2665 (weekly Fibonacci Kijun) have led to a slowdown. A breakthrough will turn the focus onto lower supports, the nearest ones are at 1.2642 (daily Fibonacci Kijun) and 1.2596 (weekly mid-term trend + upper boundary of the daily cloud). If the bulls recover their positions, the levels of the daily Ichimoku cross at 1.2725 and 1.2757 can provide initial resistance.

H4 – H1
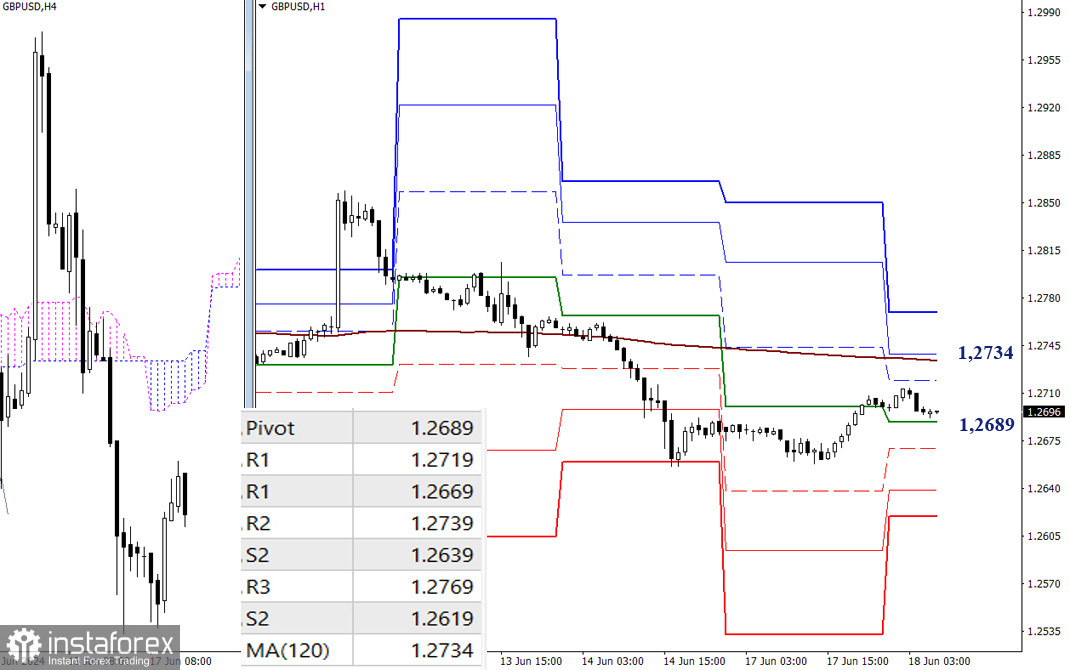
On the lower timeframes, the pair is currently in between the key levels of 1.2689 (central Pivot level) and 1.2734 (weekly long-term trend). The trend is practically flat, indicating prevailing uncertainty in the market. In case the pair chooses a particular direction, the intraday targets will be the supports (1.2669 – 1.2639 – 1.2619) and resistances (1.2739 – 1.2769) of the classic Pivot levels.
***
The technical analysis of the situation uses:
Higher timeframes - Ichimoku Kinko Hyo (9.26.52) + Fibonacci Kijun levels
Lower timeframes - H1 - Pivot Points (classic) + Moving Average 120 (weekly long-term trend)
 English
 Русский
 Bahasa Indonesia
 Bahasa Malay
 ไทย
ไทย Español
 Deutsch
 Български
 Français
 Tiếng Việt
 中文
中文 বাংলা
বাংলা हिन्दी
 Čeština
 Українська
 Română

