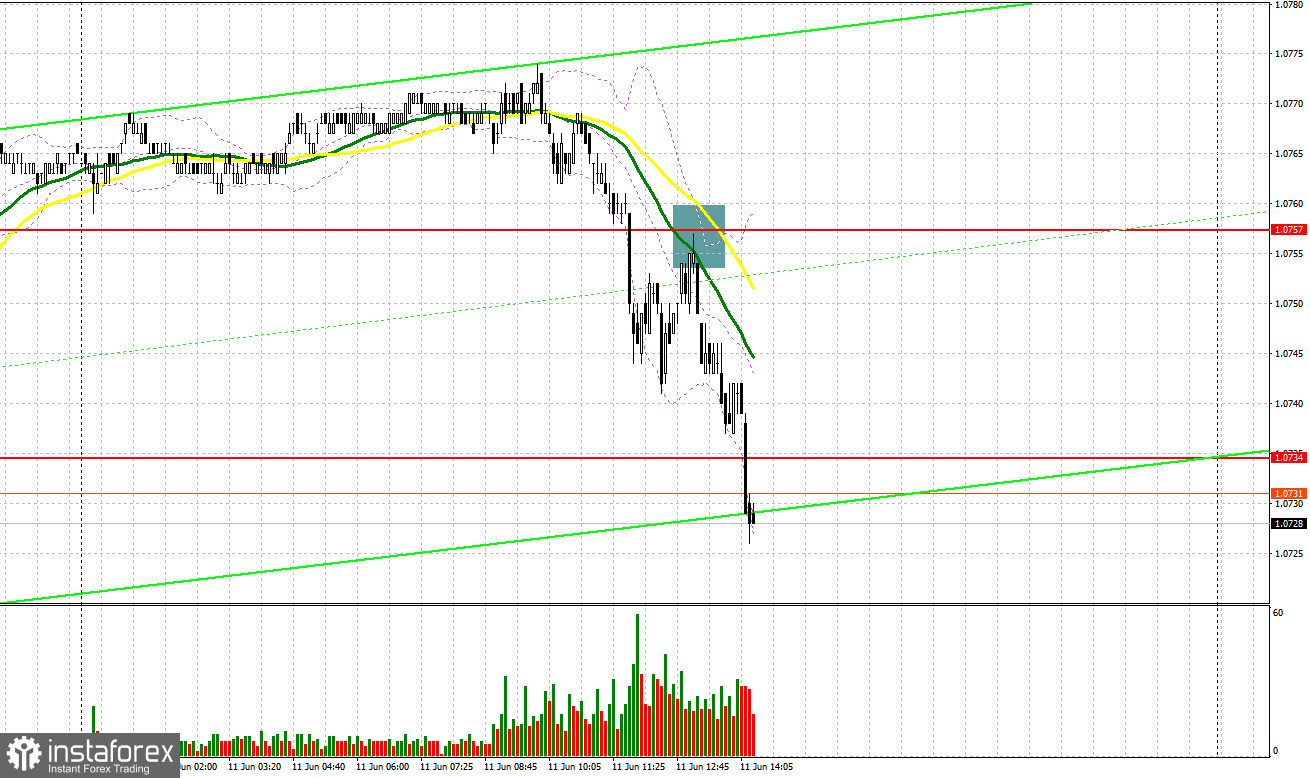
In my morning forecast, I highlighted the level of 1.0757 and planned to make market entry decisions based on it. Let's look at the 5-minute chart and see what happened. The breakout and retest of this range provided an excellent signal to sell the euro further along the trend, resulting in a drop of more than 30 points. Given the aggressive behavior of sellers during the European session, the technical picture was revised for the second half of the day.

To open long positions on EUR/USD:
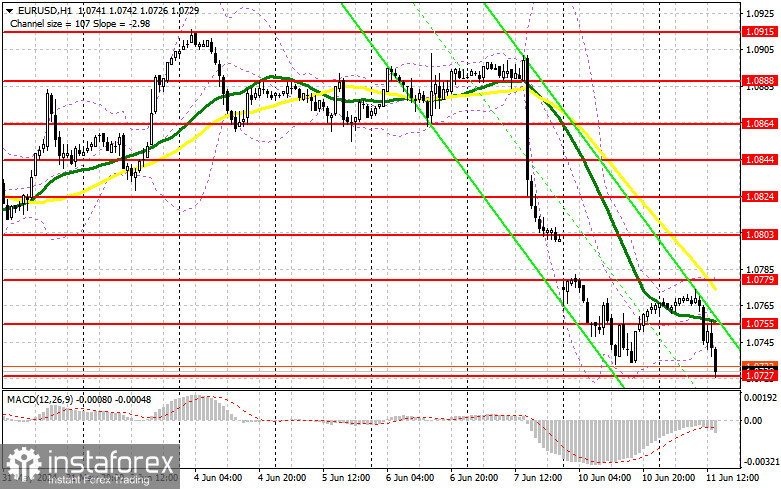
Given the complete absence of important US statistics today, buyers will now focus on defending the new support at 1.0727, formed by the first half of the day. Only forming a false breakout will provide an entry point for long positions, potentially returning EUR/USD to the resistance at 1.0755, where the moving averages are located, favoring the sellers. Breaking and updating this range from top to bottom amid a very weak report on the NFIB Small Business Optimism Index will strengthen the pair with a chance for a surge to the weekly high of 1.0779. The furthest target will be the area of 1.0803, which will allow covering the Asian gap. I will fix the profits there. If EUR/USD declines and there is no activity around 1.0727 in the second half of the day, pressure on the euro will only increase, leading to the further development of the bearish trend. In this case, I will enter only after forming a false breakout around the next support at 1.0702. I plan to open long positions immediately on a rebound from 1.0677 with a target of a 30-35 point upward correction within the day.
To open short positions on EUR/USD:
Sellers have a chance for further decline, especially ahead of the Federal Reserve meeting, where quite grim forecasts related to changes in monetary policy this year might be published. It's best to wait for a false breakout around the resistance at 1.0755 before selling, which will provide an entry point for short positions with the prospect of further euro decline and updating the support at 1.0727. A breakout and consolidation below this range, along with a retest from bottom to top, will provide another selling point, moving the pair towards the minimum of 1.0702, where I expect to see more active buyer activity. The furthest target will be the minimum at 1.0677, where I will fix profits. If EUR/USD rises in the second half of the day and there are no bears around 1.0755, pressure on the pair will decrease, and buyers will be able to restore balance in the market. In this case, I will postpone selling until testing the next resistance at 1.0779. I will also sell there, but only after an unsuccessful consolidation. I plan to open short positions immediately on a rebound from 1.0803 with a target of a 30-35 point downward correction.


Indicator Signals:
Moving averages
Trading is conducted below the 30 and 50-day moving averages, indicating further decline for the pair.
Note: The period and prices of the moving averages are considered by the author on the H1 hourly chart, differing from the classic daily moving averages on the D1 daily chart.
Bollinger Bands
In the case of a decline, the lower boundary of the indicator, around 1.0740, will act as support.
Description of indicators:
- Moving average (determines the current trend by smoothing volatility and noise). Period 50. Marked in yellow on the chart.
- Moving average (determines the current trend by smoothing volatility and noise). Period 30. Marked in green on the chart.
- MACD indicator (Moving Average Convergence/Divergence - convergence/divergence of moving averages) Fast EMA period 12. Slow EMA period 26. SMA period 9.
- Bollinger Bands. Period 20.
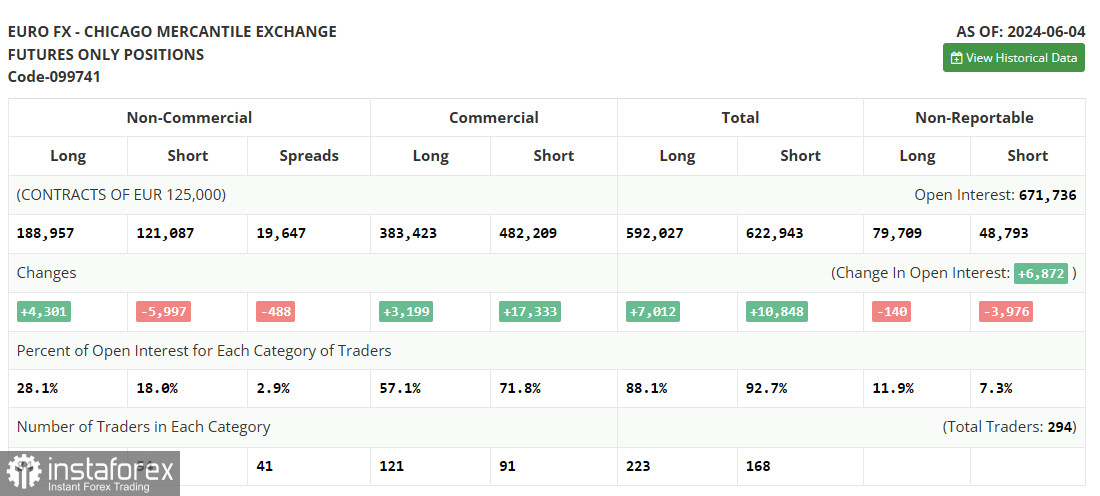
- Non-commercial traders - speculators such as individual traders, hedge funds, and large institutions using the futures market for speculative purposes and meeting certain criteria.
- Long non-commercial positions represent the total long open position of non-commercial traders.
- Short non-commercial positions represent the total short open positions of non-commercial traders.
- The total non-commercial net position is the difference between the short and long positions of non-commercial traders.
 English
 Русский
 Bahasa Indonesia
 Bahasa Malay
 ไทย
ไทย Español
 Deutsch
 Български
 Français
 Tiếng Việt
 中文
中文 বাংলা
বাংলা हिन्दी
 Čeština
 Українська
 Română

