 English
  Русский
 Bahasa Indonesia
 Bahasa Malay
 ไทย
ไทย Español
 Deutsch
 Български
 Français
 Tiếng Việt
 中文
中文 বাংলা
বাংলা हिन्दी
 Čeština
 Українська
 Română

Analysis of Thursday's deals:
1H chart of the GBP/USD pair.
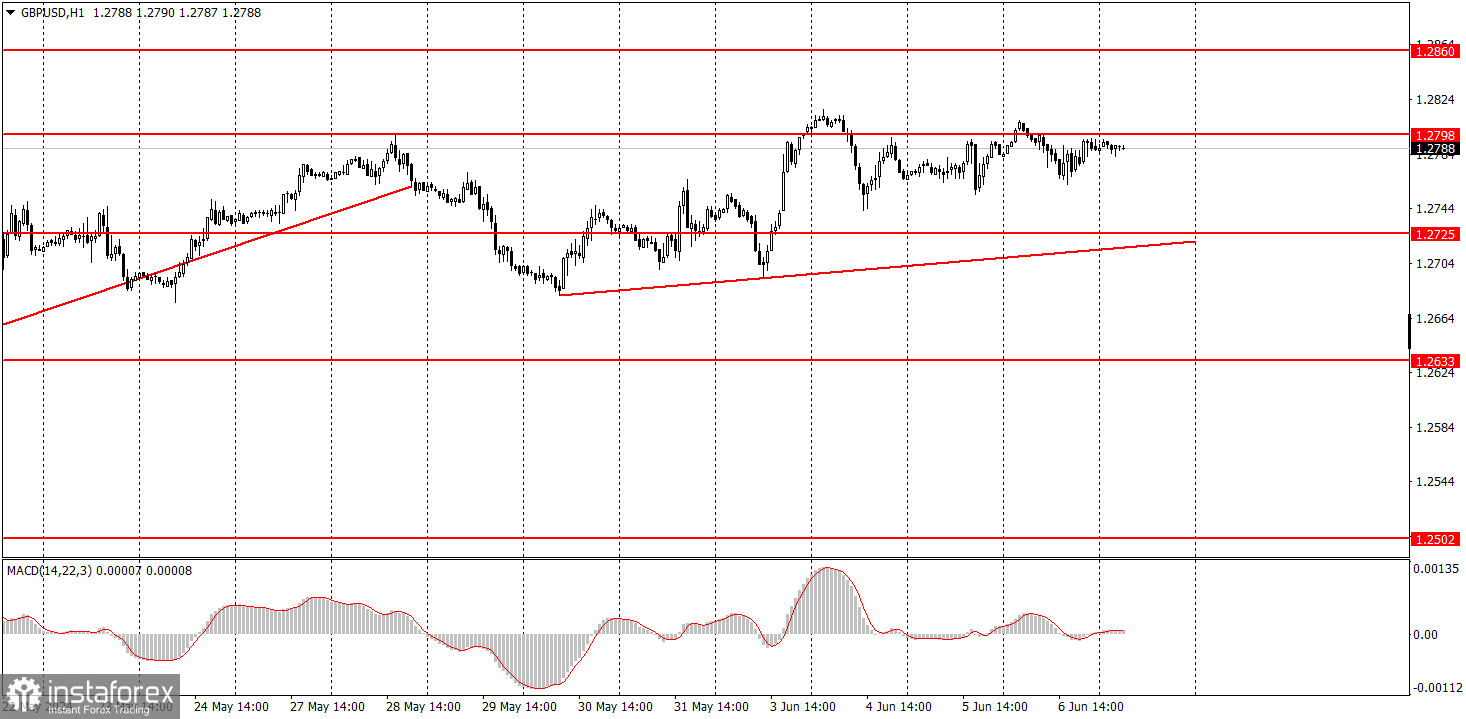
On Thursday, the GBP/USD pair remained in the same place. The ECB meeting had no influence or relevance to the British pound, even though the pound sometimes reacted to such events. Yesterday was not one of those occasions. Thus, the pair remains close to its local highs, maintaining an entirely illogical upward trend that cannot correct even slightly downward. The third consecutive upward trend line has formed and remains relevant. Recall that the price breaking below the first two lines did not lead to a fall in the pound or the formation of a downward trend. Therefore, the trend lines currently exist only to confirm the continuous growth of the pound.
Yesterday, there were a few macroeconomic events: the UK Construction PMI and US jobless claims. Both reports were of low significance, so the market did not react.
5-Minute Chart of GBP/USD
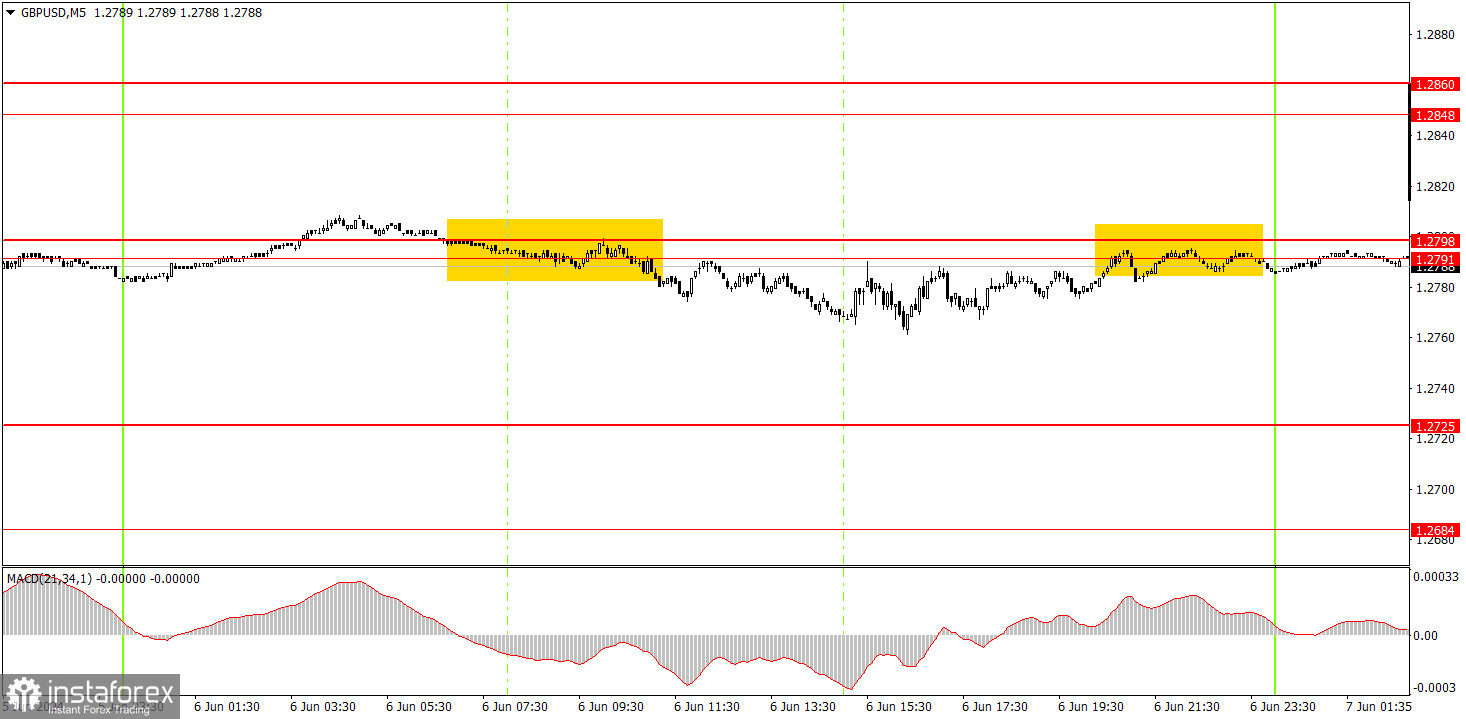
On the 5-minute timeframe on Thursday, one sell signal was formed, but volatility was minimal throughout the day, with movement practically flat. Nevertheless, novice traders could have attempted to work out the consolidation below the 1.2791-1.2798 area. The downward movement peaked at 15 points, insufficient to set a Stop Loss to break even. However, the trade could have been manually closed at breakeven as the pair moved sideways all day.
How to Trade on Friday:
On the hourly timeframe, the GBP/USD pair maintains excellent prospects for forming a downward trend, but the upward correction is still ongoing. We have no questions about movements on days when the US macroeconomic background is weak. However, novice traders should remember that the dollar falls not only on days when US macroeconomic data is negative. A clear example is Wednesday when a strong ISM index did not trigger any growth in the US currency.
On Friday, the pound sterling may continue to rise, as even this week has shown that the market remains focused only on buying. Therefore, overcoming the 1.2791-1.2798 area can be considered another buy signal.
On the 5-minute timeframe, you can now trade at levels 1.2457, 1.2502, 1.2541-1.2547, 1.2605-1.2633, 1.2684, 1.2725, 1.2791-1.2798, 1.2848-1.2860, 1.2913, 1.2980. On Friday, no significant events are scheduled in the UK, while the US will release key reports on non-farm payrolls, unemployment rate, and wage levels. These data may provoke a strong market reaction, but the dollar is unlikely to show strong growth even on good data.
Main Rules of the Trading System:
- The strength of a signal is determined by the time it takes to form (bounce or break through a level). The less time it takes, the stronger the signal.
- If two or more trades near a level are based on false signals, all subsequent signals from that level should be ignored.
- In a flat market, any pair can generate many false signals or none at all. In any case, stopping trading at the first signs of a flat is better.
- Trades should be opened between the start of the European session and the middle of the American session, after which all trades should be closed manually.
- On the hourly timeframe, trade is based on MACD indicator signals if there is good volatility and a trend is confirmed by a trend line or channel.
- If two levels are too close together (5 to 20 points), they should be considered a support or resistance area.
- After moving 20 points in the right direction, set a Stop Loss to break even.
Explanation of the Charts:
- Support and resistance levels: Targets for opening buy or sell trades. Near them, Take Profit levels can be placed.
- Red lines: Channels or lines that show the current trend and indicate the preferred trading direction.
- MACD indicator (14,22,3): Histogram and signal line – an auxiliary indicator that can also be used as a source of signals.
Important speeches and reports (always listed in the news calendar) can significantly influence the currency pair's movement. Therefore, during their release, it is recommended to trade with maximum caution or exit the market to avoid a sharp price reversal against the preceding movement.
Beginners trading on the forex market should remember that only some trades can be profitable. Developing a clear strategy and money management are key to success in trading over the long term.