 English
  Русский
 Bahasa Indonesia
 Bahasa Malay
 ไทย
ไทย Español
 Deutsch
 Български
 Français
 Tiếng Việt
 中文
中文 বাংলা
বাংলা हिन्दी
 Čeština
 Українська
 Română

EUR/USD
Higher timeframes
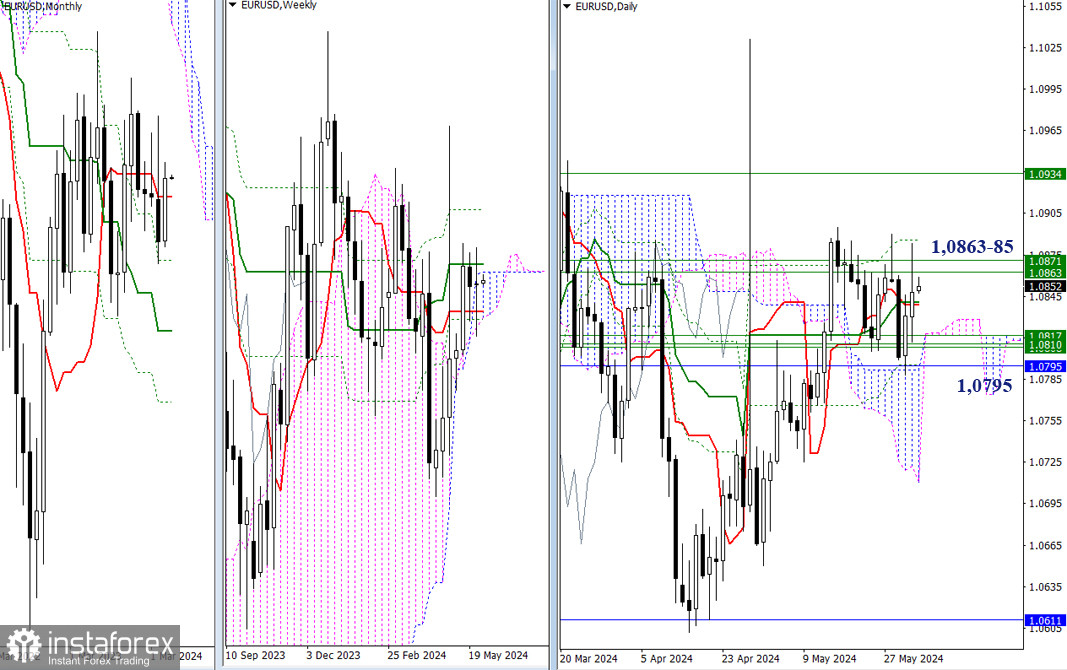
May ended with a bullish bias from the EUR/USD pair, but it is difficult to support the upward potential on the monthly candlestick as it is currently obstructed by the fact that the pair is in an uncertain area. At the same time, if we look at the lower timeframes, the charts also show uncertainty and consolidation in the nearest areas. On the weekly and daily timeframes, the pair is currently facing a cluster of resistance levels at 1.0863 – 1.0871 – 1.0885, which limit the consolidation area from above. If the price breaches these resistance levels, the bulls will direct their attention to eliminating the weekly Ichimoku dead cross (1.0934). The lower boundaries of the zone are formed by a cluster of support levels around 1.0817 – 1.0795; overcoming and a firm consolidation below this level will provide bearish prospects.
H4 – H1
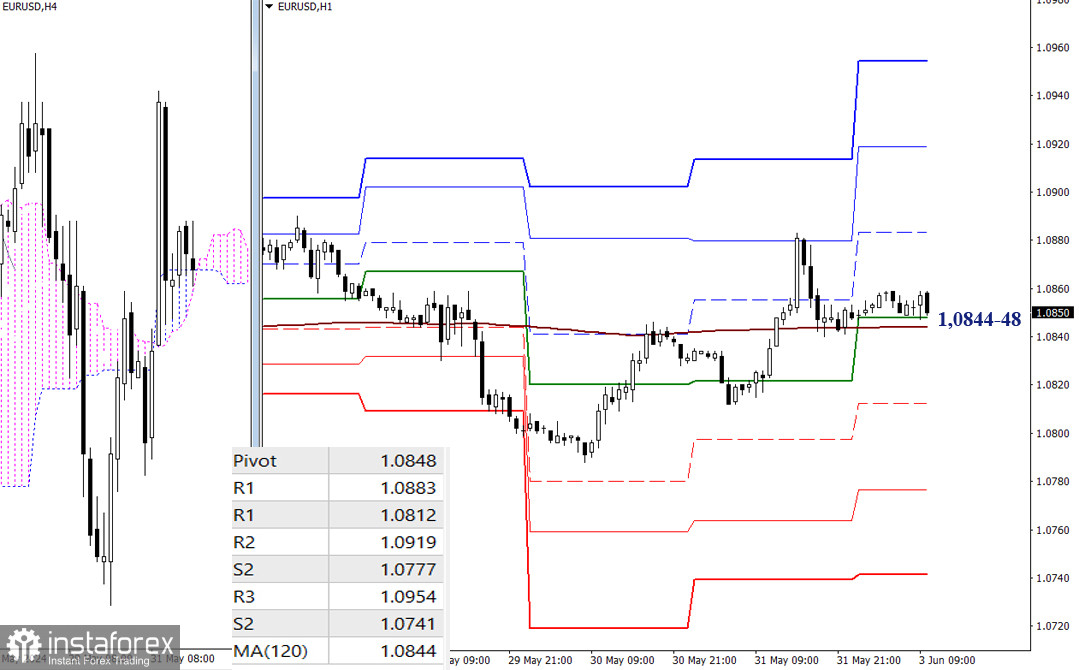
Uncertainty prevails on the lower timeframes. The market is almost at a standstill, relying on key supports of the lower timeframes, which have now converged around 1.0844-48 (central Pivot level + weekly long-term trend). If the situation changes, bullish activity will emerge intraday through the resistances of classical Pivot levels (1.0883 – 1.0919 – 1.0954), while you can take note of the support of the classic Pivot levels (1.0812 - 1.0777 - 1.0741) for the bearish bias.
***
GBP/USD
Higher Timeframes
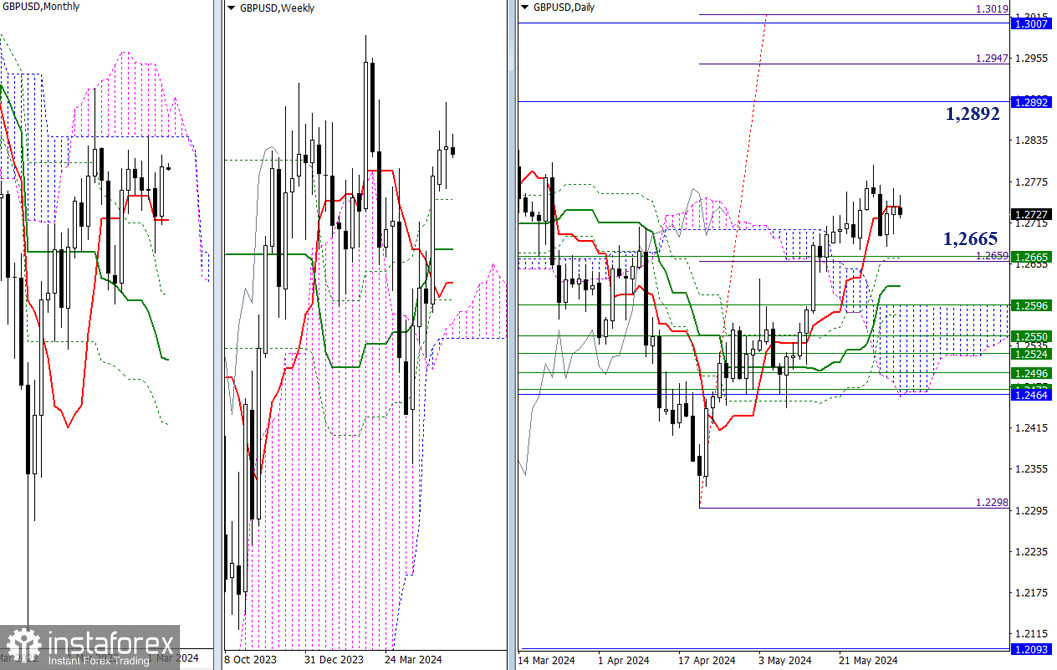
The month of May showed that the market continues to work on the rebound from the short-term trend, but the GBP/USD pair is still trading in the previous months' consolidation area. In order to have new prospects for the upward movement, the bulls need to test the March high (1.2892) and work through subsequent resistance levels of the monthly cloud (1.2892 – 1.3007) and the intraday target for breaking the cloud (1.2947 – 1.3019). In case the market decides to resume the downward movement, there is a wide area of support from levels of different time intervals. Take note of the nearest area at the boundaries of 1.2665 – 1.2622 – 1.2596.
H4 – H1
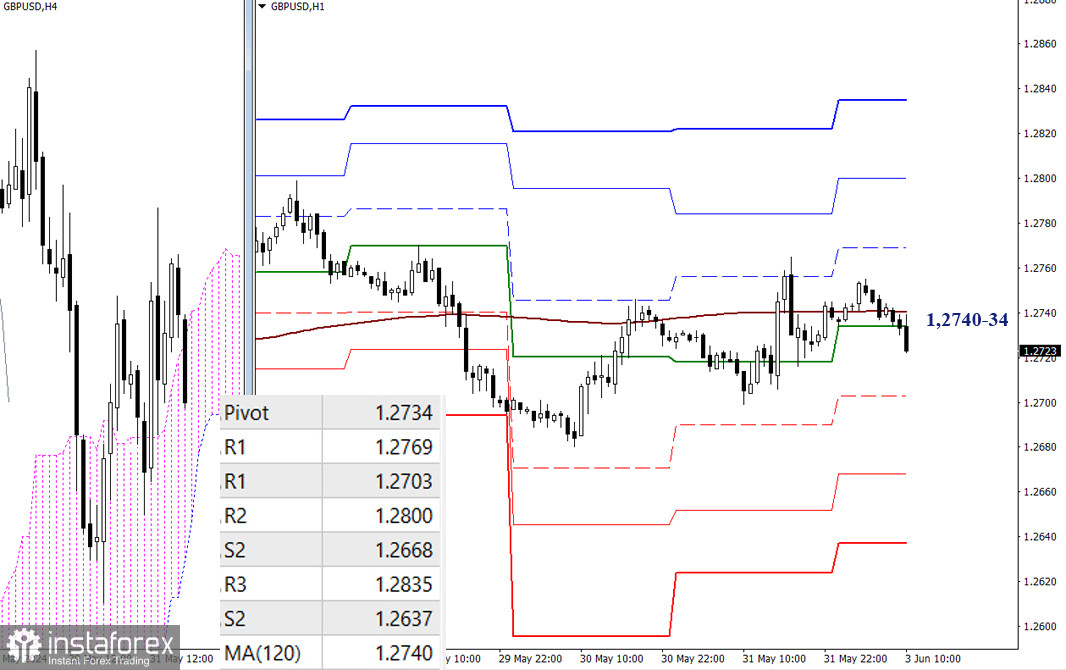
On the lower timeframes, the market is currently trading in a certain area where key levels are located, and today, they are currently in the area of 1.2740-34 (weekly long-term trend + central Pivot level of the day). Perhaps the bears will be able to turn the current decline into a new phase of the downward trend. In this case, the support of classic Pivot levels (1.2703 - 1.2668 - 1.2637) will serve as intraday targets. If the balance of power shifts in favor of the bulls, the market will encounter resistances of classical Pivot levels (1.2769 – 1.2800 – 1.2835).
***
The technical analysis of the situation uses:
Higher timeframes - Ichimoku Kinko Hyo (9.26.52) + Fibonacci Kijun levels
Lower timeframes - H1 - Pivot Points (classic) + Moving Average 120 (weekly long-term trend)