 English
  Русский
 Bahasa Indonesia
 Bahasa Malay
 ไทย
ไทย Español
 Deutsch
 Български
 Français
 Tiếng Việt
 中文
中文 বাংলা
বাংলা हिन्दी
 Čeština
 Українська
 Română

Analyzing Friday's trades:
EUR/USD on 1H chart
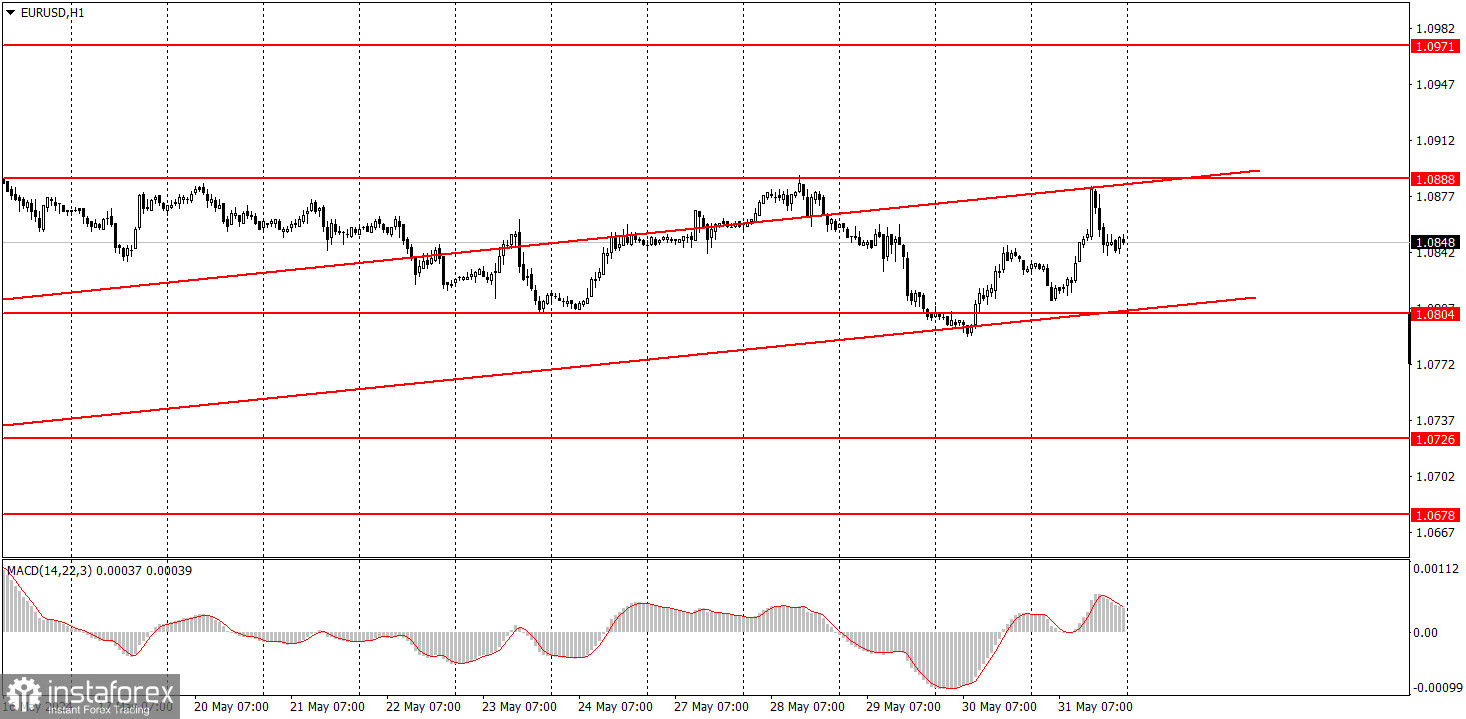
EUR/USD advanced on Friday. Almost all of last week's key reports from the Eurozone and the US worked in favor of the euro. For instance, US GDP growth in Q1 was revised down from 1.6% to 1.3%, while Eurozone inflation jumped to 2.6% instead of the forecasted 2.5%. However, things could change, and the third estimate of this report may show that US GDP could turn out to be higher than 1.3%. Inflation in the Eurozone slightly increased, but then again no one expected this indicator to decrease every month. Even macroeconomic indicators experience fluctuations. Therefore, the market only had formal reasons to buy the euro on Thursday and Friday, but it used them to the fullest. In addition, the US Personal Consumption Expenditures (PCE) Price Index remained unchanged at 2.8% in May. However, the market reacted as if the index had slowed down. In general, as before, the euro is rising for both substantial and illogical reasons.
EUR/USD on 5M chart
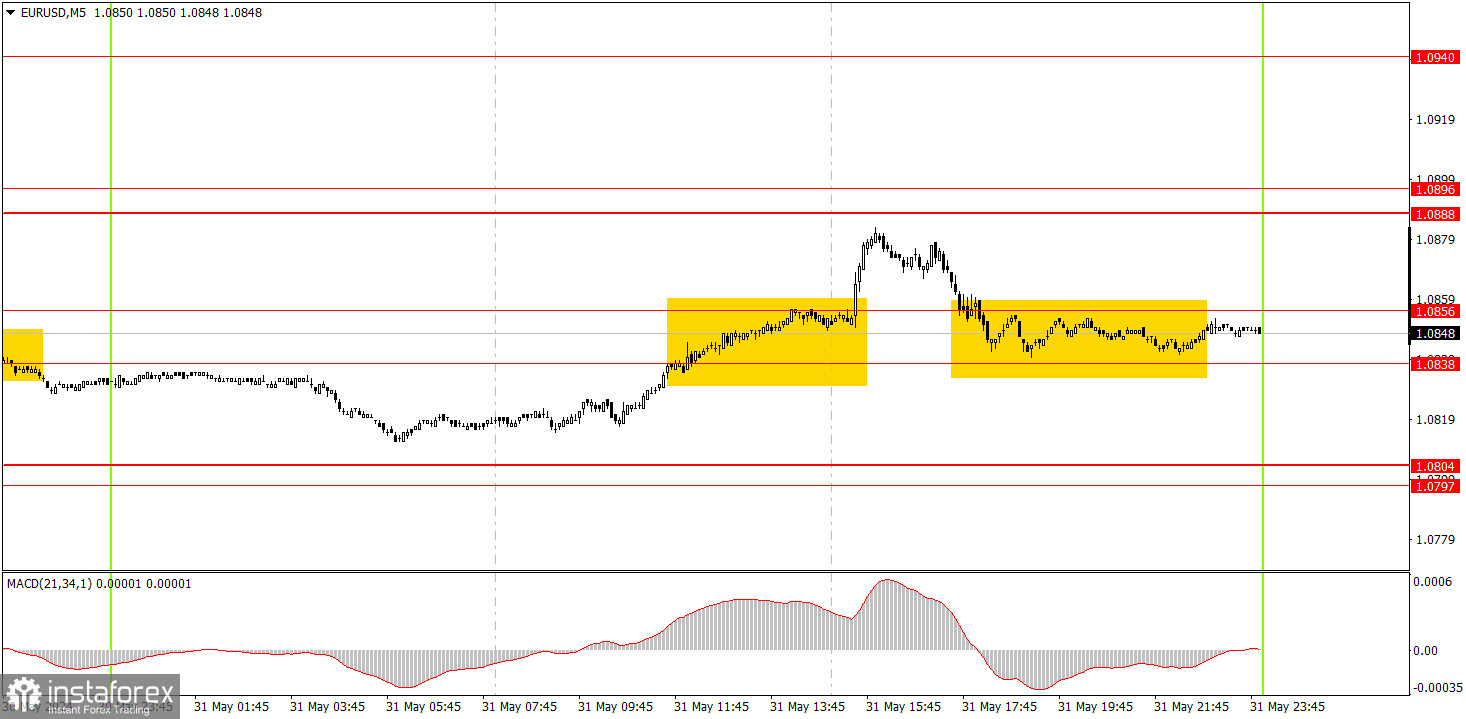
Two trading signals were formed on the 5-minute timeframe. First, the pair broke through the 1.0838-1.0856 area and then returned to it. In general, only one signal was formed. It was quite difficult to execute this buy signal, as the pair significantly rose at the beginning of the US session due to the US Core PCE Price Index. This rise was unpredictable, regardless of the forecasts. The pair did not reach the target level of 1.0888. Volatility remains relatively low.
Trading tips on Monday:
On the hourly chart, the bullish correction remains intact, which has intersected with a flat trend over the past two weeks, as EUR/USD continues to trade between the levels of 1.0804 and 1.0888. We believe that the euro should decline in the medium term, as the overall trend remains downward. Nevertheless, the market refuses to buy the dollar for unknown reasons and volatility also remains low. A downward trend may form if the price consolidates below the ascending channel.
On Monday, novice traders may look for signals around the 1.0838-1.0856 area. You may consider sell signals, but the euro could also rise at any moment. Consolidation below the ascending channel may suggest the end of the euro's current upward movement.
The key levels on the 5M chart are 1.0483, 1.0526, 1.0568, 1.0611, 1.0678, 1.0726-1.0733, 1.0797-1.0804, 1.0838-1.0856, 1.0888-1.0896, 1.0940, 1.0971-1.0981. Today, the final values of the manufacturing PMI data will be published in Germany, the US, and the Eurozone. The US ISM Manufacturing PMI is important, the rest are not crucial reports.
Basic trading rules:
1) Signal strength is determined by the time taken for its formation (either a bounce or level breach). A shorter formation time indicates a stronger signal.
2) If two or more trades around a certain level are initiated based on false signals, subsequent signals from that level should be disregarded.
3) In a flat market, any currency pair can produce multiple false signals or none at all. In any case, the flat trend is not the best condition for trading.
4) Trading activities are confined between the onset of the European session and mid-way through the U.S. session, after which all open trades should be manually closed.
5) On the 30-minute timeframe, trades based on MACD signals are only advisable amidst substantial volatility and an established trend, confirmed either by a trendline or trend channel.
6) If two levels lie closely together (ranging from 5 to 15 pips apart), they should be considered as a support or resistance zone.
How to read charts:
Support and Resistance price levels can serve as targets when buying or selling. You can place Take Profit levels near them.
Red lines represent channels or trend lines, depicting the current market trend and indicating the preferable trading direction.
The MACD(14,22,3) indicator, encompassing both the histogram and signal line, acts as an auxiliary tool and can also be used as a signal source.
Significant speeches and reports (always noted in the news calendar) can profoundly influence the price dynamics. Hence, trading during their release calls for heightened caution. It may be reasonable to exit the market to prevent abrupt price reversals against the prevailing trend.
Beginning traders should always remember that not every trade will yield profit. Establishing a clear strategy coupled with sound money management is the cornerstone of sustained trading success.