 English
  Русский
 Bahasa Indonesia
 Bahasa Malay
 ไทย
ไทย Español
 Deutsch
 Български
 Français
 Tiếng Việt
 中文
中文 বাংলা
বাংলা हिन्दी
 Čeština
 Українська
 Română

Gold
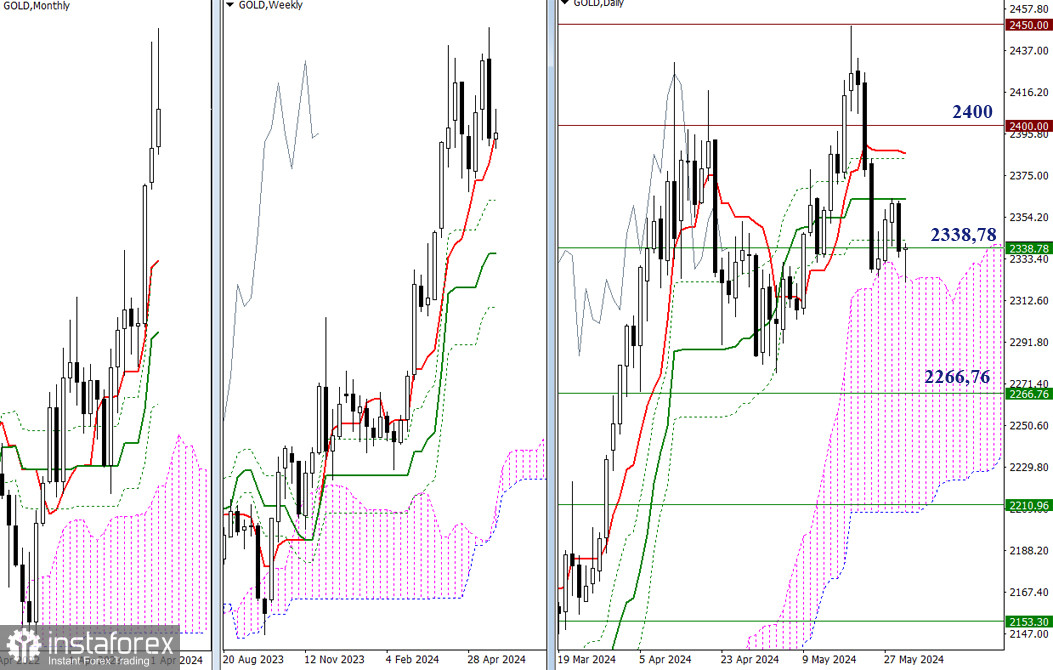
Last week, a prominent candlestick combination, an absorption pattern, was formed. However, we have not seen a confirmation or any progress on the bearish bias. This might be due to the month-end. The bears may summarize the results and return to focusing on strengthening their positions at the start of the new month. To do this, it will be crucial for them to break through the daily cloud, reinforced by weekly support levels (2266.76 – 2210.96). If the bears fail to achieve their goals, the bulls will recover their positions, reclaiming the highs to continue the upward trend. In these conditions, they will face the resistances of the daily Ichimoku cross (2363.17 – 2385.81) and the psychological levels of 2400 and 2450 that were previously tested.
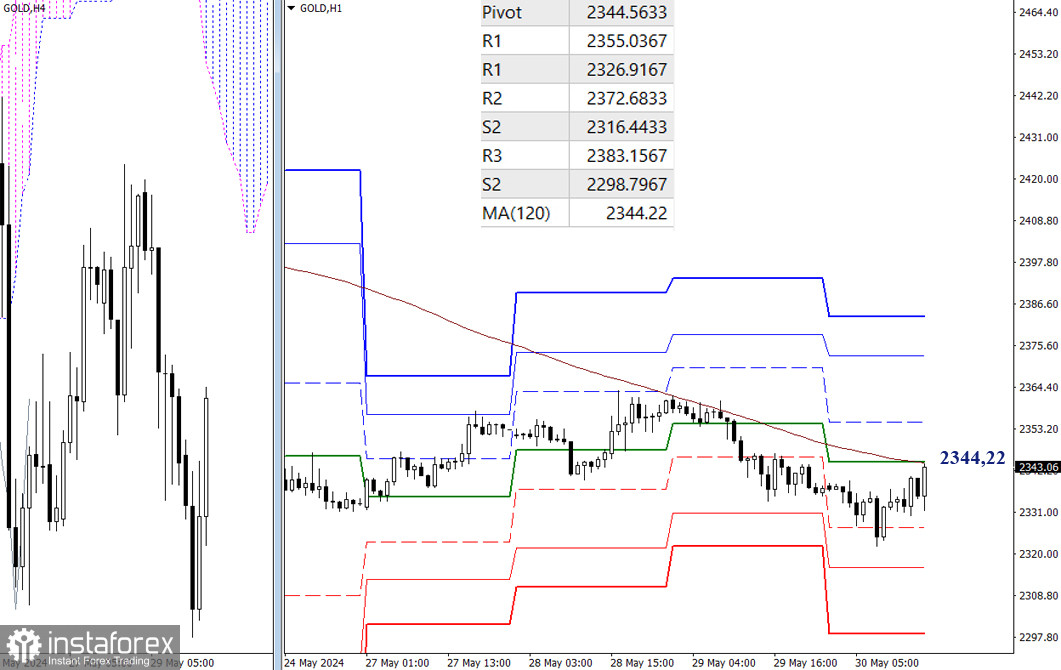
H4 – H1
The bears have the main advantage on the lower timeframes. However, the market is closely approaching the resistance of the weekly long-term trend (2344.22). Testing, breaking through, and reversing this level could shift the balance of power in favor of the bulls. In this case, the targets for the upward movement will be the resistances of the classic Pivot levels, currently located at 2355.04, 2372.68, and 2383.16.
If the price bounces off and resumes the decline, it will initially be important to exit the correction zone (2322.06) and then proceed to test the supports of the classic Pivot levels (2316.44 – 2298.80).
***
The technical analysis of the situation uses:
Higher timeframes - Ichimoku Kinko Hyo (9.26.52) + Fibonacci Kijun levels
Lower timeframes - H1 - Pivot Points (classic) + Moving Average 120 (weekly long-term trend)