 English
  Русский
 Bahasa Indonesia
 Bahasa Malay
 ไทย
ไทย Español
 Deutsch
 Български
 Français
 Tiếng Việt
 中文
中文 বাংলা
বাংলা हिन्दी
 Čeština
 Українська
 Română

USD/JPY
On the daily chart, the wedge-like structure of the Marlin oscillator's signal line is particularly noticeable. There is a higher probability of a break below the line, which could resemble the movement that we saw on May 15-16, but this time with a consolidation below the MACD indicator line and also below the Fibonacci level of 38.2% (155.04). The first signal is when the price returns below the 61.8% corrective level at 157.00.
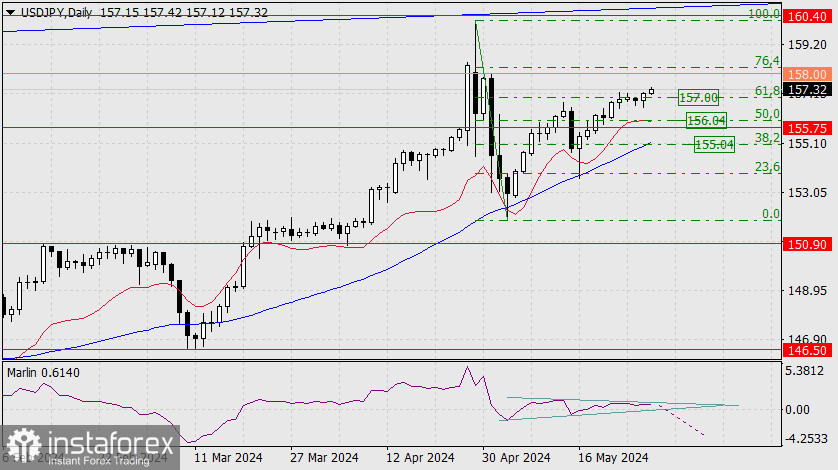
If the price breaks this main scenario, the oscillator wedge will transform into a channel, and the price will continue to rise above the 158.00 level, attempting to overcome the 76.4% Fibonacci level.
On the 4-hour chart, Marlin has been moving sideways within a narrow range since May 17. Yesterday, we saw the signal line's first attempt to drop below the boundary of the downtrend territory, but Marlin quickly went back to the bullish territory since the price is in a strong position – above the balance (red) and MACD (blue) indicator lines. There was even a bounce off the balance line.
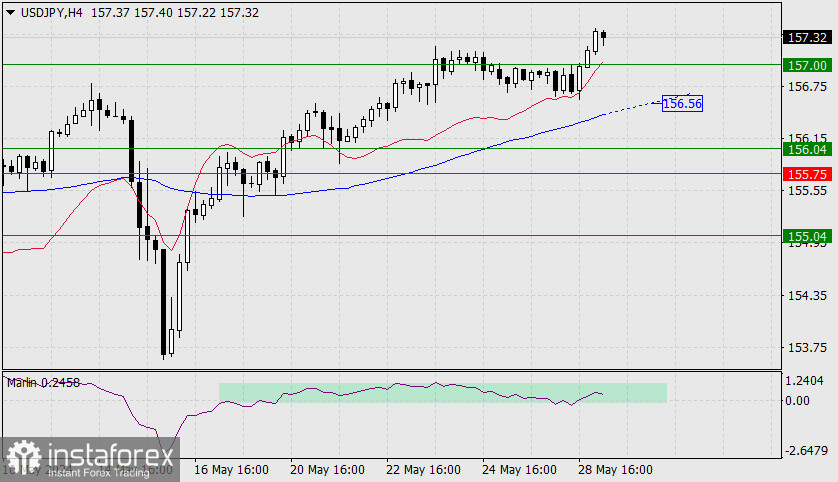
So what needs to happen in order to stop the rise against the alternative scenario? The price needs to firmly consolidate below the 157.00 level. Furthermore, the price must breach the support of the MACD line near the 156.56 mark.