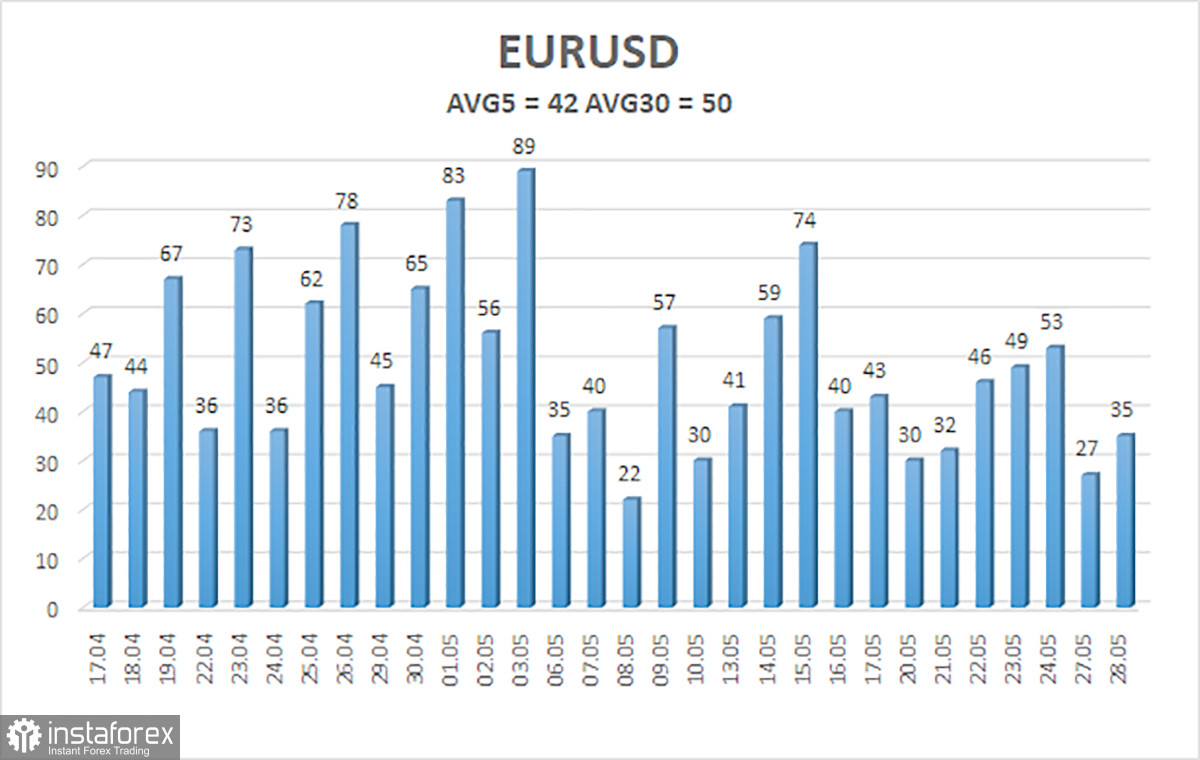
EUR/USD continued its upward movement on Tuesday. The euro advanced in the absence of significant news and reports. Some may argue that the growth was quite weak, both on Monday and Tuesday. However, we want to highlight the fact that the pair's volatility has been low for quite some time, as shown below. The fact that the single currency is slowly rising does not negate the fact that it is continuously growing, even if it has no grounds or reasons to do so.
There were no events that could have triggered the euro's growth. On Friday, two out of two reports supported the dollar. Yet, the euro and the pound continue to rise, but not the dollar. Therefore, we can only draw the same conclusions as before. Firstly, the rise is completely illogical. Secondly, if one were to trade these currency pairs now, it would only be based on "pure" technical analysis. It is simply impossible to buy the euro right now considering the fundamentals and macroeconomics.
We would also like to highlight the fact we usually hear news and reports that should have supported the dollar. We often receive reports that the Federal Reserve does not intend to lower the key rate in the near future, while the European Central Bank is ready to start monetary policy easing as early as June. Market participants ignore this information, as they don't consider it important.
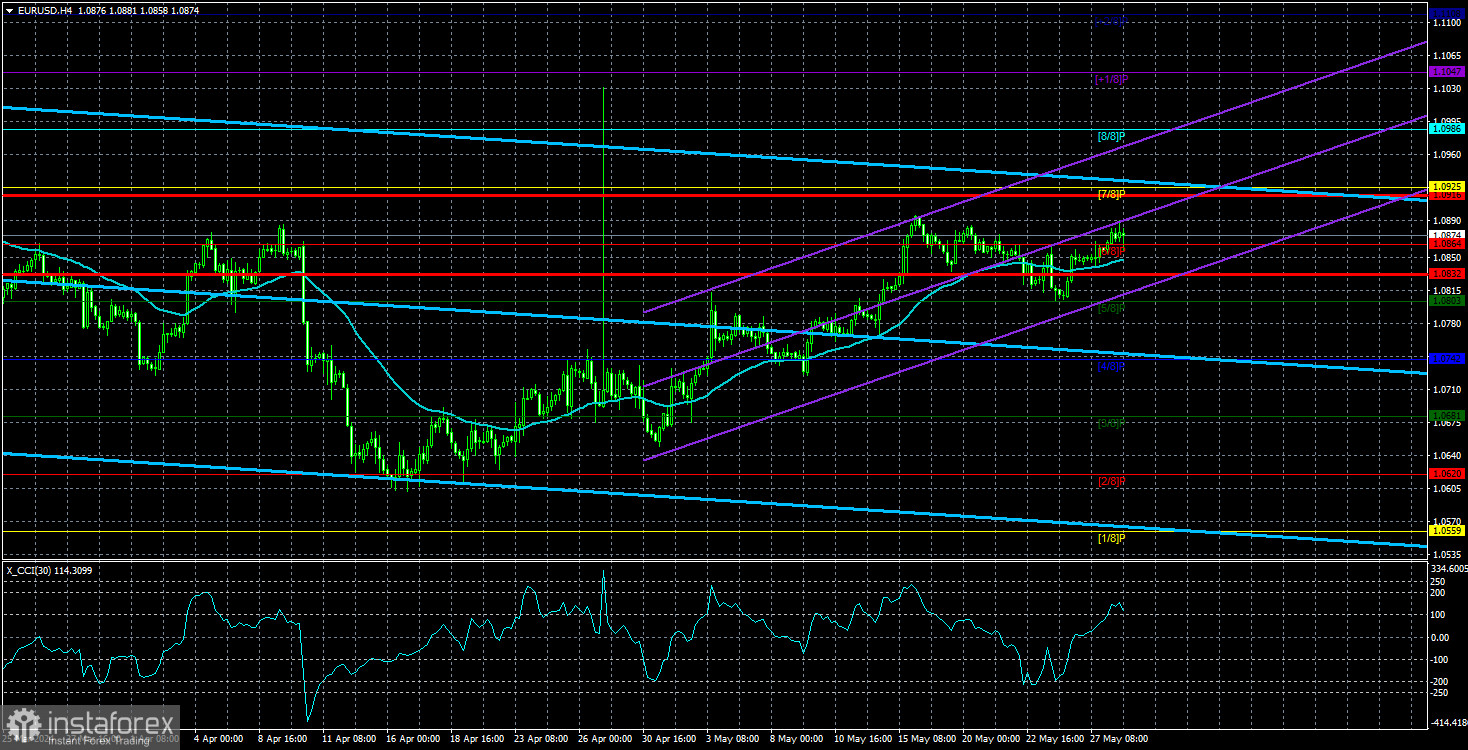
As for "pure" technical analysis, the price remains above the moving average line. Therefore, if any traders are operating solely on the 4-hour timeframe, they can continue to buy the pair. It is very difficult to predict how far the euro might rise, as there is no logic behind its growth. The market is simply buying the single currency, disregarding the incoming data. We have often mentioned this for the past six months. The upward movement is so weak that the euro has only appreciated by 2.5 cents over a month and a half of almost continuous growth. We believe that traders need to understand that the upward movement is illogical and all market movements are very weak before they decide to enter the market.
Yesterday, Neel Kashkari said that the Fed should wait for significant progress on inflation before cutting rates. He noted that the Fed has no need to lower rates as the labor market and the economy are in good condition. In other words, the central bank has time to wait for inflation to fall to the target level. These remarks further confirm that a Fed rate cut is absolutely not a near-term prospect.

As of May 29, the average volatility of the EUR/USD pair over the last five trading days is 42 pips, which is considered low. We expect the pair to move between the levels of 1.0832 and 1.0916 on Wednesday. The long-term linear regression channel is directed downward, indicating that the global downward trend persists. The CCI indicator entered the oversold area last month, which triggered the upward movement. However, the bullish correction has lasted long enough so it's difficult to expect it to end anytime soon.
Nearest support levels:
- S1 – 1.0864
- S2 – 1.0803
- S3 – 1.0742
Nearest resistance levels:
- R1 – 1.0925
- R2 – 1.0986
- R3 – 1.1047
Trading Recommendations:
The EUR/USD pair maintains a downtrend, but the bullish correction remains intact. The euro is expected to resume its decline in the medium term, yet the market continues to interpret almost every event against the dollar. The single currency continues to gradually rise even in the absence of any news. In terms of selling, it is necessary to wait for the price to firmly consolidate below the moving average. We believe that it would be unwise to consider long positions even if the price is above the moving average. However, if someone trades purely on technical analysis, long positions are relevant with targets at 1.0916 and 1.0925 as long as the price is above the moving average.
Explanation of Illustrations:
- Linear Regression Channels – Helps determine the current trend. If both are directed in the same direction, it means the trend is currently strong.
- Moving Average Line (settings 20.0, smoothed) – Determines the short-term trend and the direction in which trading should currently be conducted.
- Murray Levels – Target levels for movements and corrections.
- Volatility Levels (red lines) – The probable price channel in which the pair will spend the next day, based on current volatility indicators.
- CCI Indicator – Its entry into the oversold area (below -250) or the overbought area (above +250) means that a trend reversal in the opposite direction is imminent.
 English
 Русский
 Bahasa Indonesia
 Bahasa Malay
 ไทย
ไทย Español
 Deutsch
 Български
 Français
 Tiếng Việt
 中文
中文 বাংলা
বাংলা हिन्दी
 Čeština
 Українська
 Română

