Analysis of GBP/USD 5M

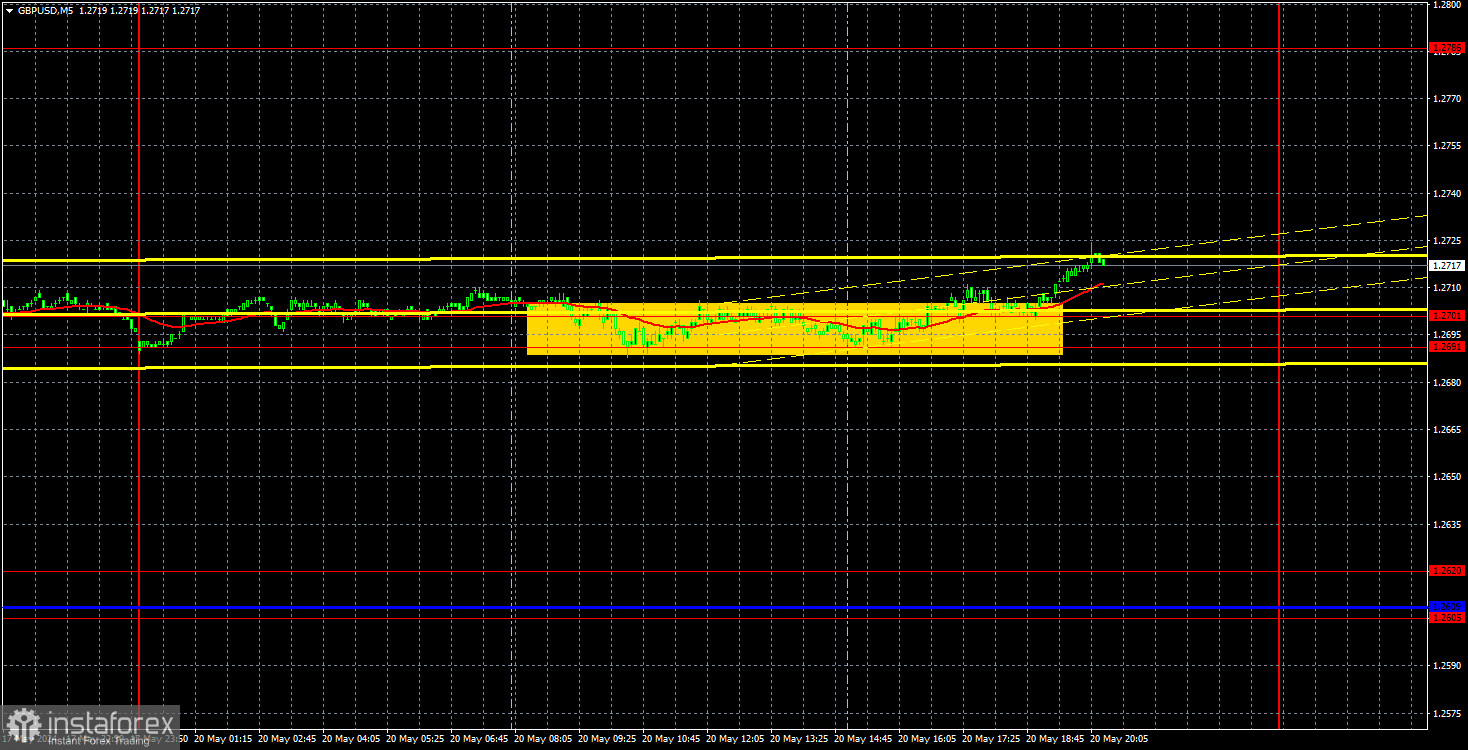
GBP/USD spent almost the entire day in a flat range between 1.2691 and 1.2701. Yes, you read that correctly, the price stayed within a 10-point sideways channel throughout the European trading session and half of the US session. That pretty much sums up the British currency's movement on Monday. In the middle of the US session, the price did not break above this range, but the upward movement was short-lived. It's questionable whether it was even worth trying to capitalize on this buy signal, which took about 8 hours to form, given that the overall volatility for the day didn't even reach 40 pips. The ascending trend line on the hourly timeframe remains relevant, with no signs of the British currency's growth ending at this time.
The British pound continues to rise without any substantial basis, but this fact hardly surprises traders anymore. For the past six months (or even longer), the pound has consistently shown illogical growth. So we witnessed once again how the pound rises even with low market activity, even on a Monday, even with a complete lack of fundamental and macroeconomic events, even after a 250-pip rally, and even in the face of the Bank of England's anticipated rate cut this summer. If any of our readers had doubts regarding our conclusions about the groundless growth, they could have verified it for themselves yesterday. It is hard to say how long this movement will last. From a technical perspective, trading upwards is possible, but fundamentally, it is difficult to justify buying the pair.
COT report:

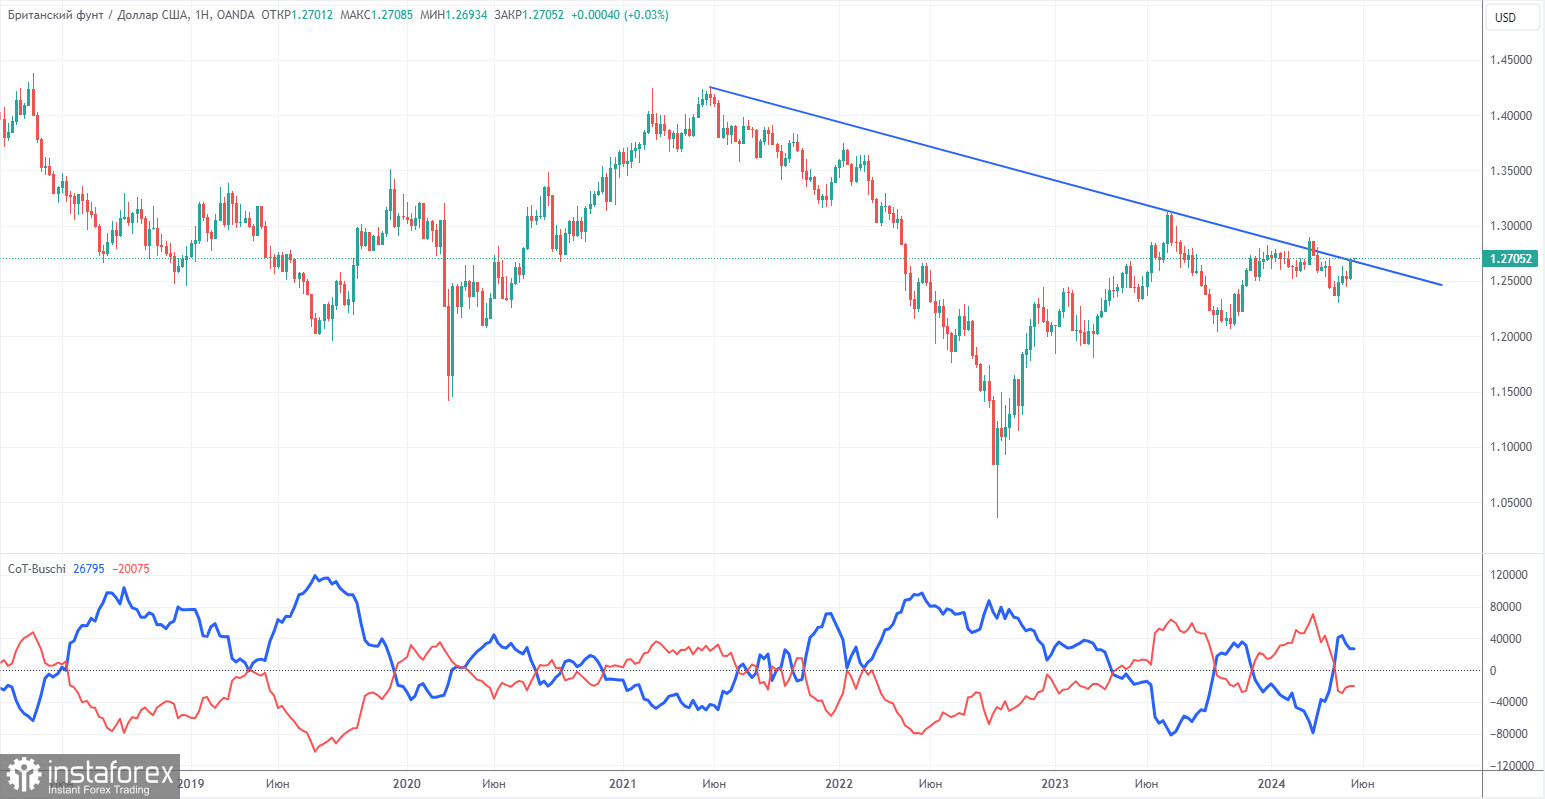
COT reports on the British pound show that the sentiment of commercial traders often fluctuated over the past few years. The red and blue lines, which represent the net positions of commercial and non-commercial traders, constantly intersect and generally remain close to the zero mark. According to the latest report on the British pound, the non-commercial group closed 3,100 buy contracts and 4,800 short ones. As a result, the net position of non-commercial traders increased by 1,700 contracts in a week. Sellers continue to hold their ground, but they have a small advantage. The fundamental background still does not provide a basis for long-term purchases of the pound sterling, and the currency has a good chance to resume the global downward trend. The trend line on the 24-hour TF clearly shows this. Almost all of the factors point to the pound's decline, but it continues to resist.
The non-commercial group currently has a total of 48,600 buy contracts and 68,700 sell contracts. Now the bulls no longer have the advantage, and the bears are in control. We can only hope that inflation in the UK does not accelerate, or that the Bank of England will not intervene.
Analysis of GBP/USD 1H

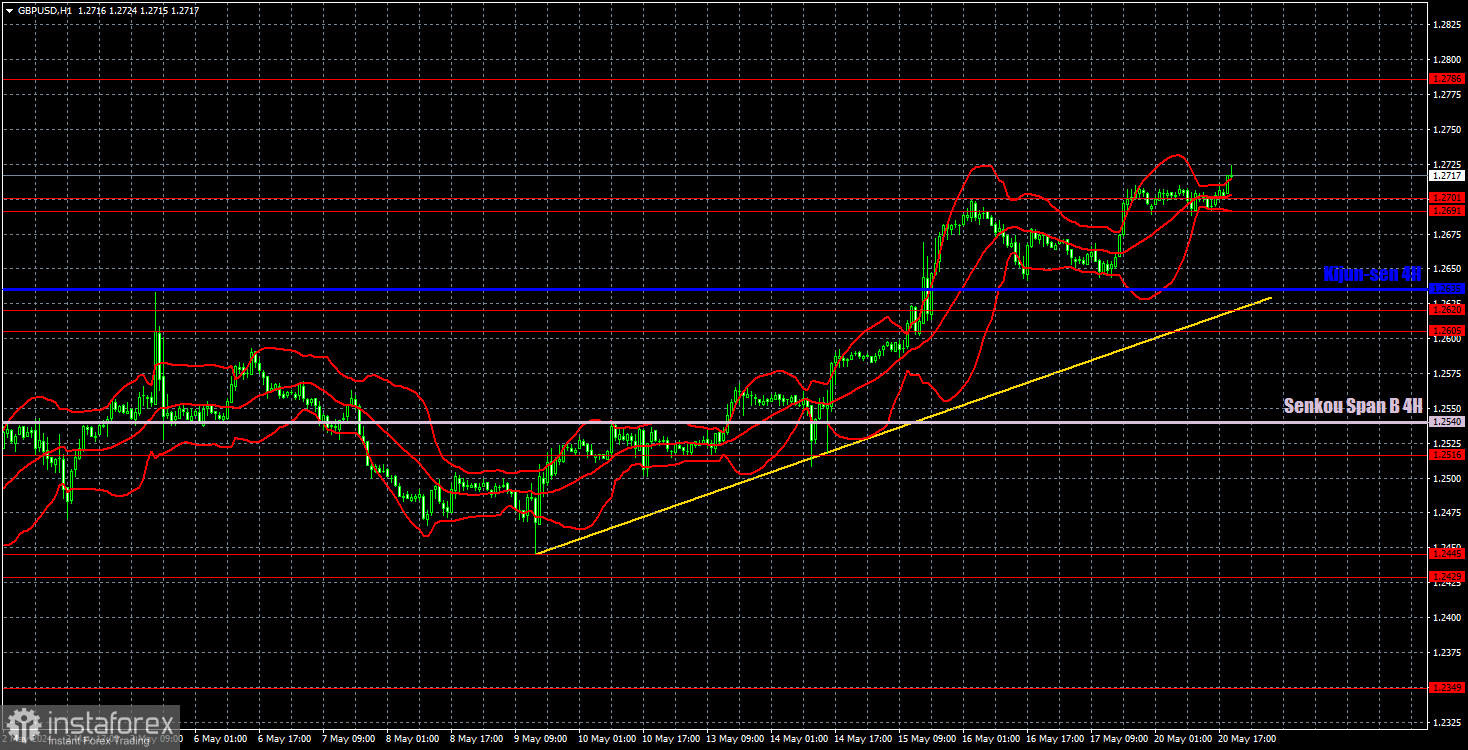
On the 1H chart, GBP/USD continues to go through a bullish correction. The price overcame the 1.2605-1.2620 area on the second attempt without any issues, and the 1.2691-1.2701 area also failed to stop buyers. The market shows that it is willing to buy the pound regardless of the fundamental and macroeconomic background, or even the lack thereof. This means that the pair's movement is groundless, so it's pointless to try to look for any patterns. Even breaking the current trend line will not necessarily mean that a decline will start.
As of May 21, we highlight the following important levels: 1.2215, 1.2269, 1.2349, 1.2429-1.2445, 1.2516, 1.2605-1.2620, 1.2691-1.2701, 1.2786, 1.2863, 1.2981-1.2987. The Senkou Span B (1.2540) and Kijun-sen (1.2635) lines can also serve as sources of signals. Don't forget to set a Stop Loss to breakeven if the price has moved in the intended direction by 20 pips. The Ichimoku indicator lines may move during the day, so this should be taken into account when determining trading signals.
On Tuesday, no important events or reports are scheduled in the US. Bank of England Governor Andrew Bailey will speak, which could be very interesting. More precisely, it would be interesting if the market reacted logically to all the news and events. Since this is not the case, it doesn't really matter what Bailey says. The market is highly likely to interpret his words in favor of the pound.
Description of the chart:
Support and resistance levels are thick red lines near which the trend may end. They do not provide trading signals;
The Kijun-sen and Senkou Span B lines are the lines of the Ichimoku indicator, plotted to the 1H timeframe from the 4H one. They provide trading signals;
Extreme levels are thin red lines from which the price bounced earlier. They provide trading signals;
Yellow lines are trend lines, trend channels, and any other technical patterns;
Indicator 1 on the COT charts is the net position size for each category of traders;
 English
 Русский
 Bahasa Indonesia
 Bahasa Malay
 ไทย
ไทย Español
 Deutsch
 Български
 Français
 Tiếng Việt
 中文
中文 বাংলা
বাংলা हिन्दी
 Čeština
 Українська
 Română

