 English
  Русский
 Bahasa Indonesia
 Bahasa Malay
 ไทย
ไทย Español
 Deutsch
 Български
 Français
 Tiếng Việt
 中文
中文 বাংলা
বাংলা हिन्दी
 Čeština
 Українська
 Română

Analyzing Wednesday's trades:
GBP/USD on 1H chart
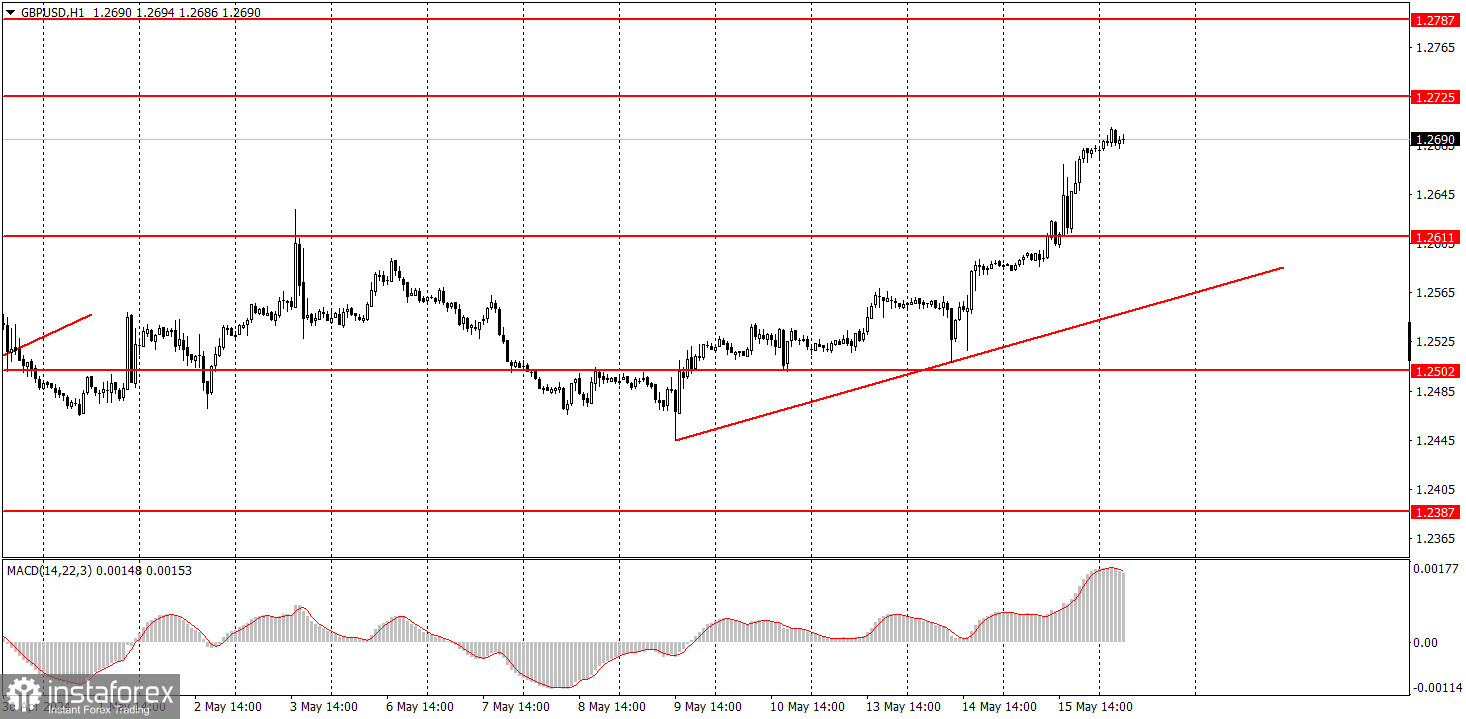
GBP/USD continued to rise throughout Thursday, although it had no reasons to do so. As we have previously mentioned, the US inflation report showed a minor slowdown, but what matters more is how much inflation has decreased, what prospects it opens up for the Federal Reserve's rate, and how much the actual value corresponded to the forecast. The answers to these three questions are unequivocal. Inflation decreased by only 0.1%, this does not open up any prospects, and the forecasted value also corresponded to the actual value. However, the market used this small opportunity to sell the dollar and buy the pound. Over the past six months, we have repeatedly mentioned that the pound is rising more often than it should, and the market interprets most macroeconomic and fundamental events in favor of the British currency. Yesterday, we could once again see this in action.
GBP/USD on 5M chart
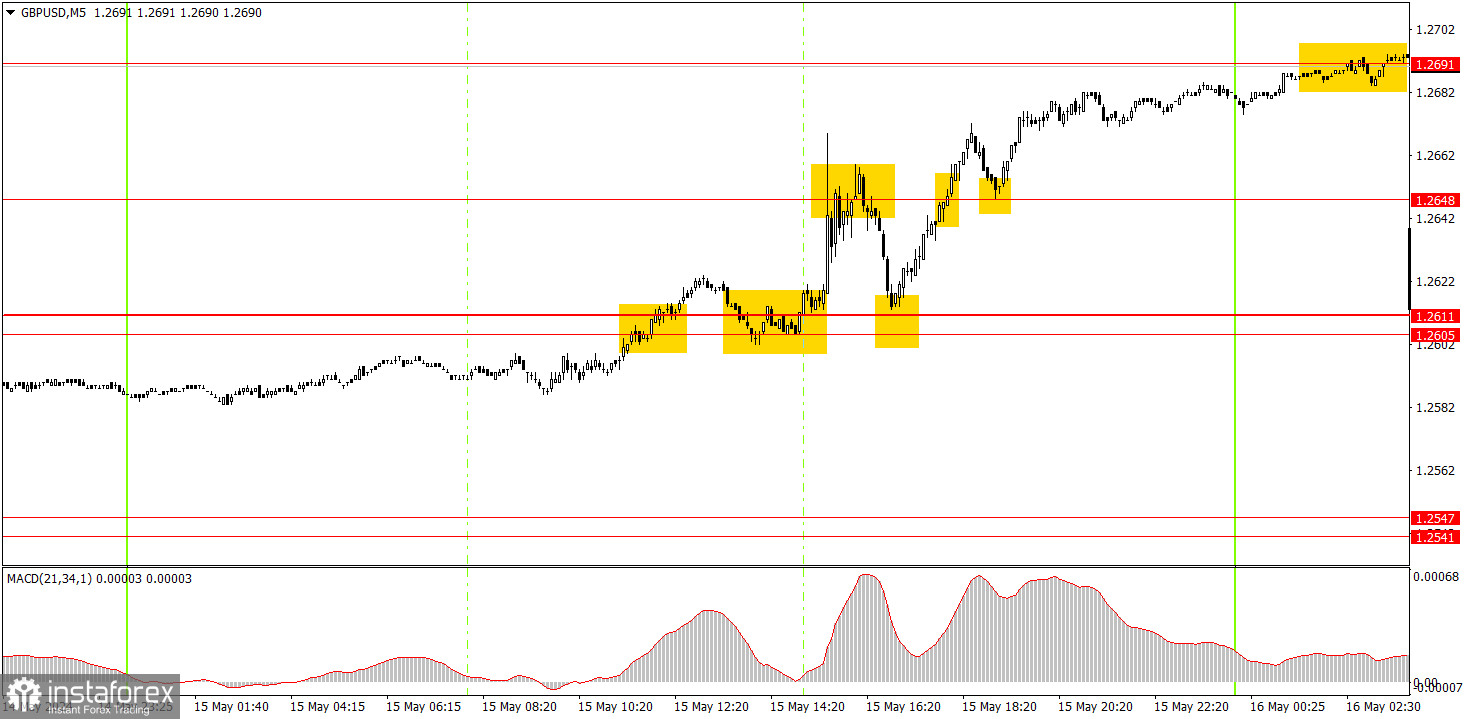
Traders had enough signals on the 5-minute timeframe to make profit on Wednesday. Initially, the pair formed two buy signals around the 1.2605-1.2611 area. After that, the price reached the nearest target level at 1.2648, followed by a bounce. The price returned to the 1.2605-1.2611 area and bounced off it again. Then it moved up about 60 pips to the level of 1.2691. In total, these three trades could have brought about 70-80 pips of profit.
Trading tips on Thursday:
On the hourly chart, the GBP/USD pair has great prospects for forming a downward trend, but the bullish correction remains intact. The fundamental backdrop continues to support the dollar much more than the British pound. The economic reports often fail to support the pound, but the market practically interprets all the news in favor of the British currency.
If we are talking about logical movements, then we expect the pound to fall on Thursday. However, the market raises the value of the British currency every day, so we can assume that the pair will also rise on Thursday. And it doesn't matter if this happens in the absence of a strong macroeconomic background. A bounce from the level of 1.2691 could trigger a slight decline.
The key levels on the 5M chart are 1.2270, 1.2310, 1.2372-1.2387, 1.2457, 1.2502, 1.2541-1.2547, 1.2605-1.2611, 1.2648, 1.2691, 1.2725, 1.2787-1.2791. No important events are scheduled in the UK. The US docket will feature reports on the number of issued building permits and industrial production. These are secondary of importance, but the market can use them to open new long positions.
Basic trading rules:
1) Signal strength is determined by the time taken for its formation (either a bounce or level breach). A shorter formation time indicates a stronger signal.
2) If two or more trades around a certain level are initiated based on false signals, subsequent signals from that level should be disregarded.
3) In a flat market, any currency pair can produce multiple false signals or none at all. In any case, the flat trend is not the best condition for trading.
4) Trading activities are confined between the onset of the European session and mid-way through the U.S. session, after which all open trades should be manually closed.
5) On the 30-minute timeframe, trades based on MACD signals are only advisable amidst substantial volatility and an established trend, confirmed either by a trendline or trend channel.
6) If two levels lie closely together (ranging from 5 to 15 pips apart), they should be considered as a support or resistance zone.
How to read charts:
Support and Resistance price levels can serve as targets when buying or selling. You can place Take Profit levels near them.
Red lines represent channels or trend lines, depicting the current market trend and indicating the preferable trading direction.
The MACD(14,22,3) indicator, encompassing both the histogram and signal line, acts as an auxiliary tool and can also be used as a signal source.
Significant speeches and reports (always noted in the news calendar) can profoundly influence the price dynamics. Hence, trading during their release calls for heightened caution. It may be reasonable to exit the market to prevent abrupt price reversals against the prevailing trend.
Beginners should always remember that not every trade will yield profit. Establishing a clear strategy coupled with sound money management is the cornerstone of sustained trading success.