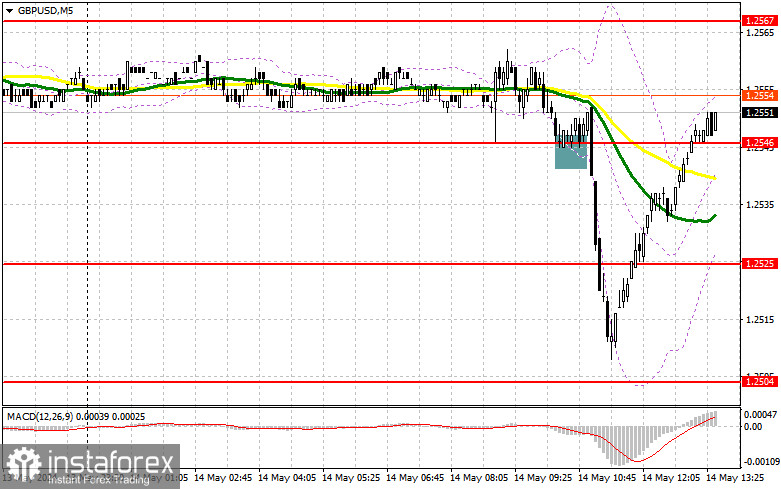
In my morning forecast, I highlighted the level of 1.2546 and planned to make decisions based on it for market entry. Let's look at the 5-minute chart and analyze what happened there. The decline and the formation of a false breakout signaled a buy, but the rise never materialized, resulting in loss realization. The technical picture was reassessed for the second half of the day.

To open long positions on GBP/USD, the following is required:
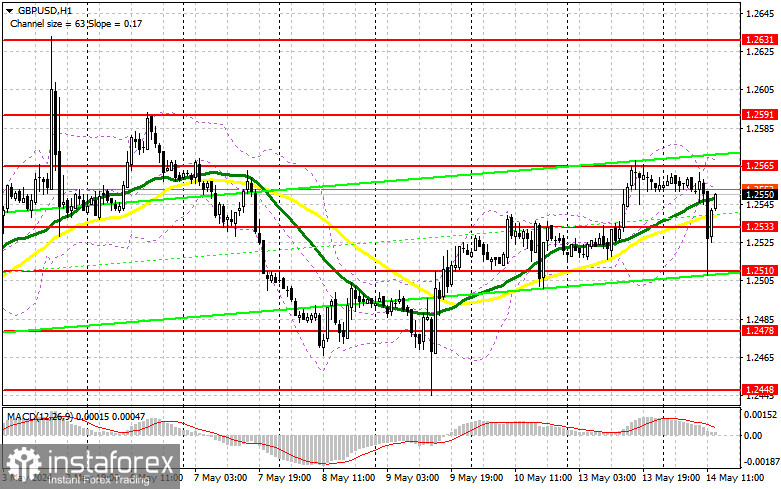
Despite fairly decent labor market data from the UK and the rise in British wages, the pound initially chose to drop significantly before returning to the recent uptrend. On the one hand, loss realization allowed us to confirm the presence of major players in the market betting on further pair growth. The US Producer Price Index will be released in the second half of the day, and Federal Reserve Chairman Jerome Powell will speak. The policy maker's firm stance on inflation and rate uncertainty could trigger another sharp decline in the pound. Whether there will be buyers this time is a rather tricky question. If the statements are cautious, I will consider buying near the support at 1.2533. A suitable entry point for long positions capable of pushing the pound towards 1.2565, where trading is currently taking place, can only be obtained after a false breakout. Only a breakout and retest of the upper boundary of this range against the backdrop of weak US data - a chance for GBP/USD to rise with an update to 1.2591. If it breaks above this range, we can talk about a surge to 1.2631, which is unlikely. I will take profit there. In the scenario of GBP/USD decline and the absence of buyers at 1.2533 in the second half of the day, pressure on the pound will increase, leading to a downward movement towards 1.2510 - the day's low. False breakout formation there will be a suitable entry point into the market. I plan to immediately open long positions on GBP/USD on a rebound from 1.2478 with a target of 30-35 point correction within the day.
To open short positions on GBP/USD, the following is required:
If the Fed Chairman's statements are dovish, buyers will try to break through the resistance at 1.2565, which is currently the main focus. Therefore, only a false breakout there will lead to an entry point into short positions with the target of GBP/USD falling towards 1.2533. However, a breakout and reverse retest of this range will increase pressure on the pair, giving bears an advantage and another selling point to update 1.2510. Testing this level will put buyers in a very precarious position. The more distant target will be the minimum of 1.2478, where I will take profit. In the scenario of a GBP/USD rise and the absence of bears at 1.2565 in the second half of the day, bulls will have the opportunity to continue the uptrend and update the level of 1.2591. If there is no activity, I advise opening short positions on GBP/USD from 1.2631, counting on the pair's rebound down by 30-35 points within the day.


Indicator signals:
Moving Averages
Trading is conducted around the 30 and 50-day moving averages, indicating market uncertainty.
Note: The author considers the period and prices of moving averages on the hourly chart H1, which differs from the general definition of classic daily moving averages on the daily chart D1.
Bollinger Bands
In case of a decline, the lower boundary of the indicator, around 1.2550, will act as support.
Description of Indicators:
- Moving average (determines the current trend by smoothing volatility and noise). Period 50. Marked in yellow on the chart.
- Moving average (determines the current trend by smoothing volatility and noise). Period 30. Marked in green on the chart.
- MACD indicator (Moving Average Convergence/Divergence). Fast EMA period 12. Slow EMA period 26. SMA period 9.
- Bollinger Bands. Period 20.
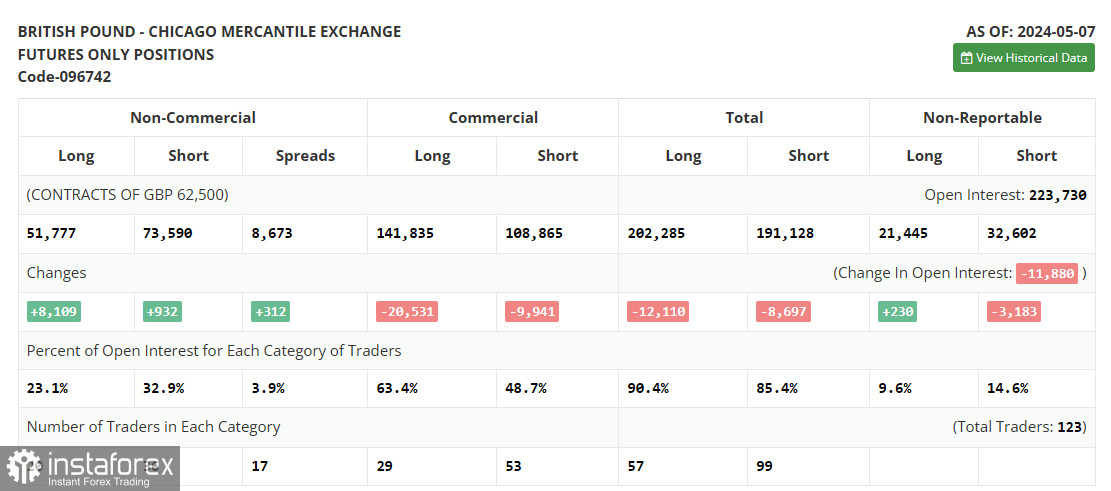
- Non-commercial traders - speculators, such as individual traders, hedge funds, and large institutions, use the futures market for speculative purposes and meet certain requirements.
- Long non-commercial positions represent the total long open position of non-commercial traders.
- Short non-commercial positions represent the total short open positions of non-commercial traders.
- The total non-commercial net position is the difference between the short and long positions of non-commercial traders.
 English
 Русский
 Bahasa Indonesia
 Bahasa Malay
 ไทย
ไทย Español
 Deutsch
 Български
 Français
 Tiếng Việt
 中文
中文 বাংলা
বাংলা हिन्दी
 Čeština
 Українська
 Română

