Analysis of GBP/USD 5M

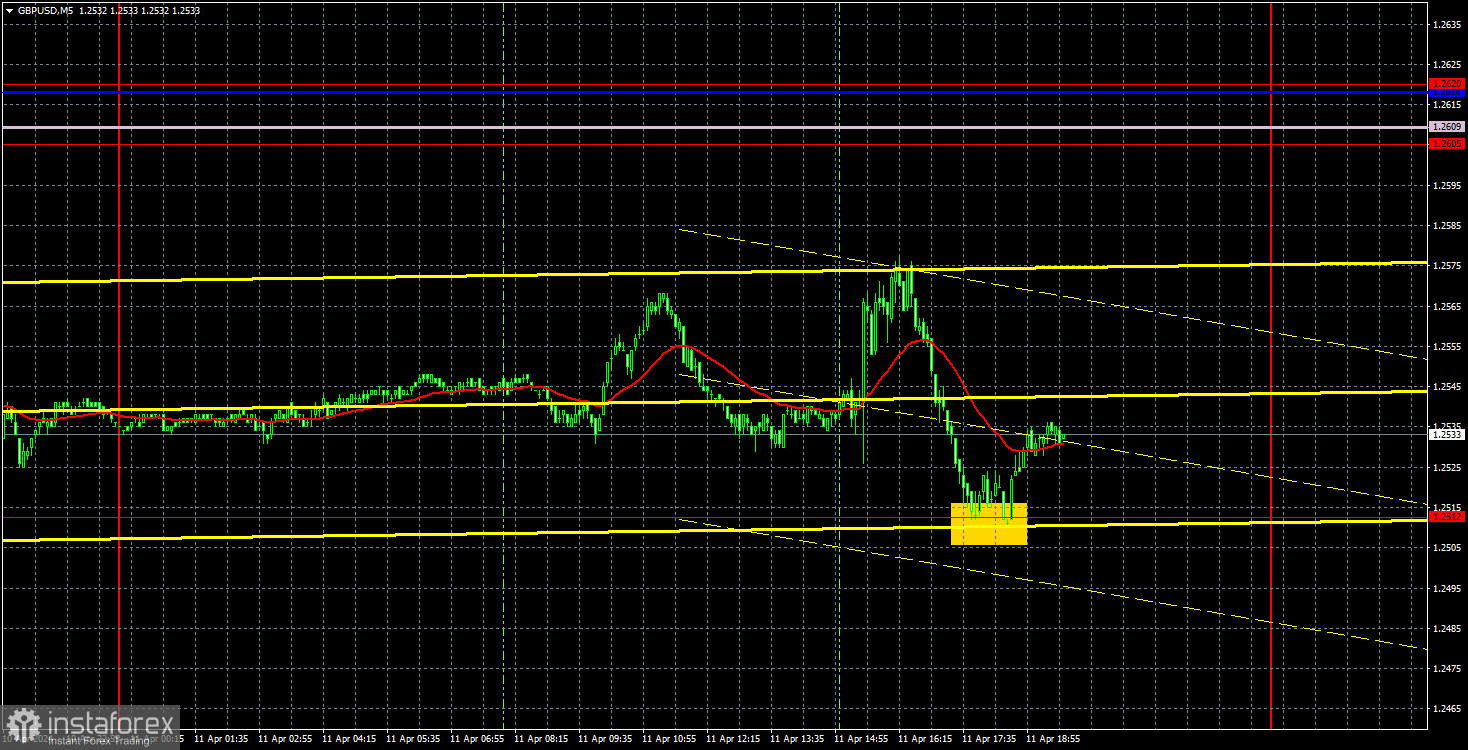
GBP/USD made another attempt to settle below the level of 1.2516, which can be considered the lower boundary of the sideways channel on the 24-hour timeframe. We witnessed an attempt to break through this level, but it was more for appearances' sake. The day before, it seemed that bears needed to take one more step to break out of the 4-month flat, but even that proved to be beyond their capabilities. Therefore, even after the pair fell by 200 pips on Wednesday, the flat persists and can last indefinitely. Maybe even another four months.
We've talked a lot about the flat and trading within it. In short, movements within the flat are often illogical and erratic. Therefore, each trader should decide for themselves whether they will enter the market when the pair is trading very weakly and predominantly sideways, and most of the time, macro data and fundamentals do not lead to consistent movements. There is still hope that the pair will attempt to break below the level of 1.2516, but it is very weak. Despite the fact that the Federal Reserve will not start the monetary easing cycle in June, which means that the central bank will maintain a hawkish stance for a much longer period than the market predicted, the US dollar is not rising against the pound. The market simply refuses to buy it.
Only one trading signal was generated yesterday. During the US trading session, the pair bounced off the level of 1.2512, and traders had the opportunity to earn 20-25 pips on this signal. The pair did not reach the nearest target level during the day, so the position should have been manually closed in the evening.
COT report:

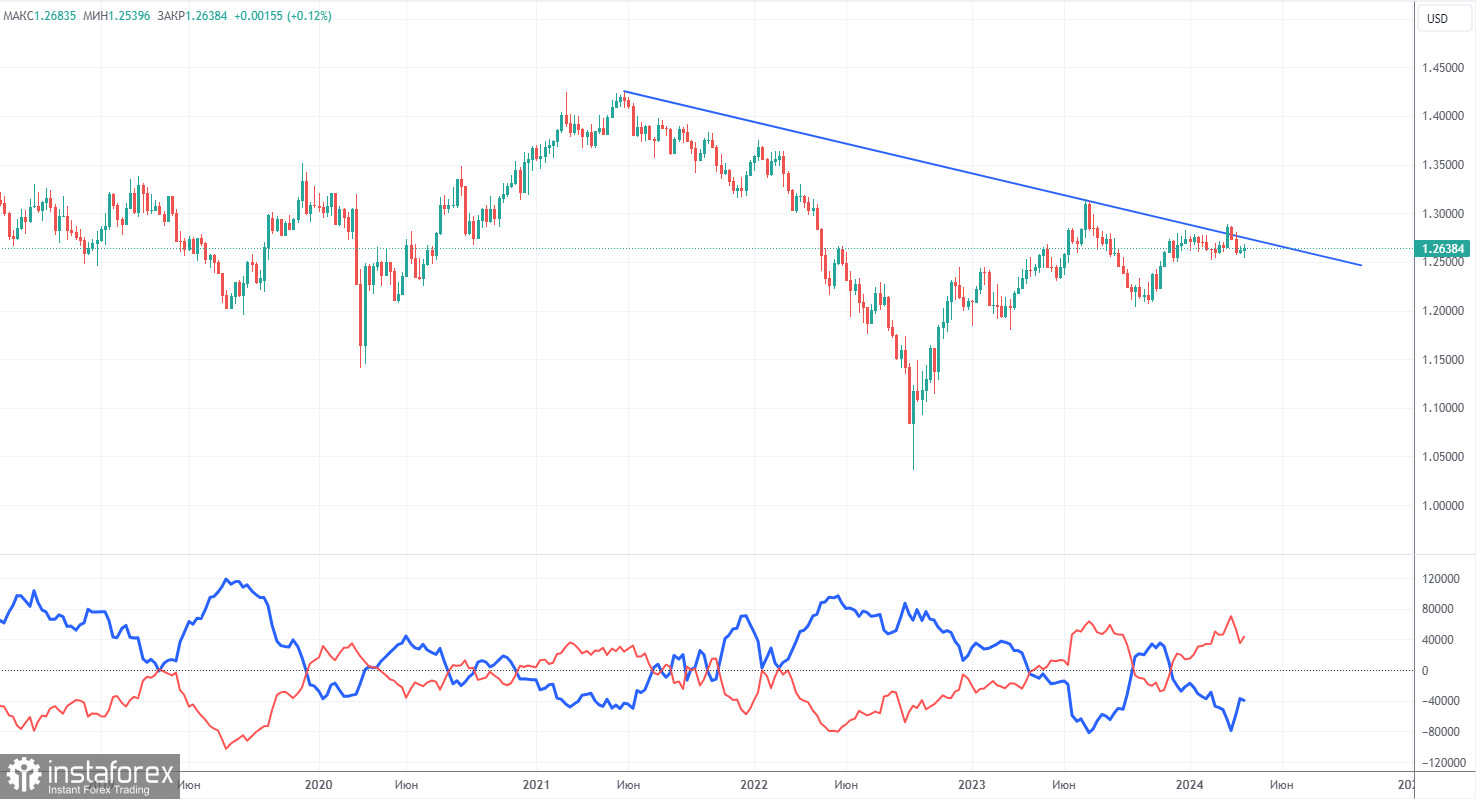
COT reports on the British pound show that the sentiment of commercial traders has frequently changed in recent months. The red and blue lines, which represent the net positions of commercial and non-commercial traders, constantly intersect and, in most cases, remain close to the zero mark. According to the latest report on the British pound, the non-commercial group opened 7,000 buy contracts and closed 1,100 short ones. As a result, the net position of non-commercial traders increased by 8,100 contracts in a week. The fundamental background still does not provide a basis for long-term purchases of the pound sterling, and the currency remains in a sideways channel.
The non-commercial group currently has a total of 98,300 buy contracts and 55,000 sell contracts. The bulls no longer have a significant advantage. Although the pound refuses to fall, such absurd movements cannot persist forever. The technical analysis also suggests that the pound should fall further (descending trend line), but we still have a flat state on the 24-hour timeframe.
Analysis of GBP/USD 1H

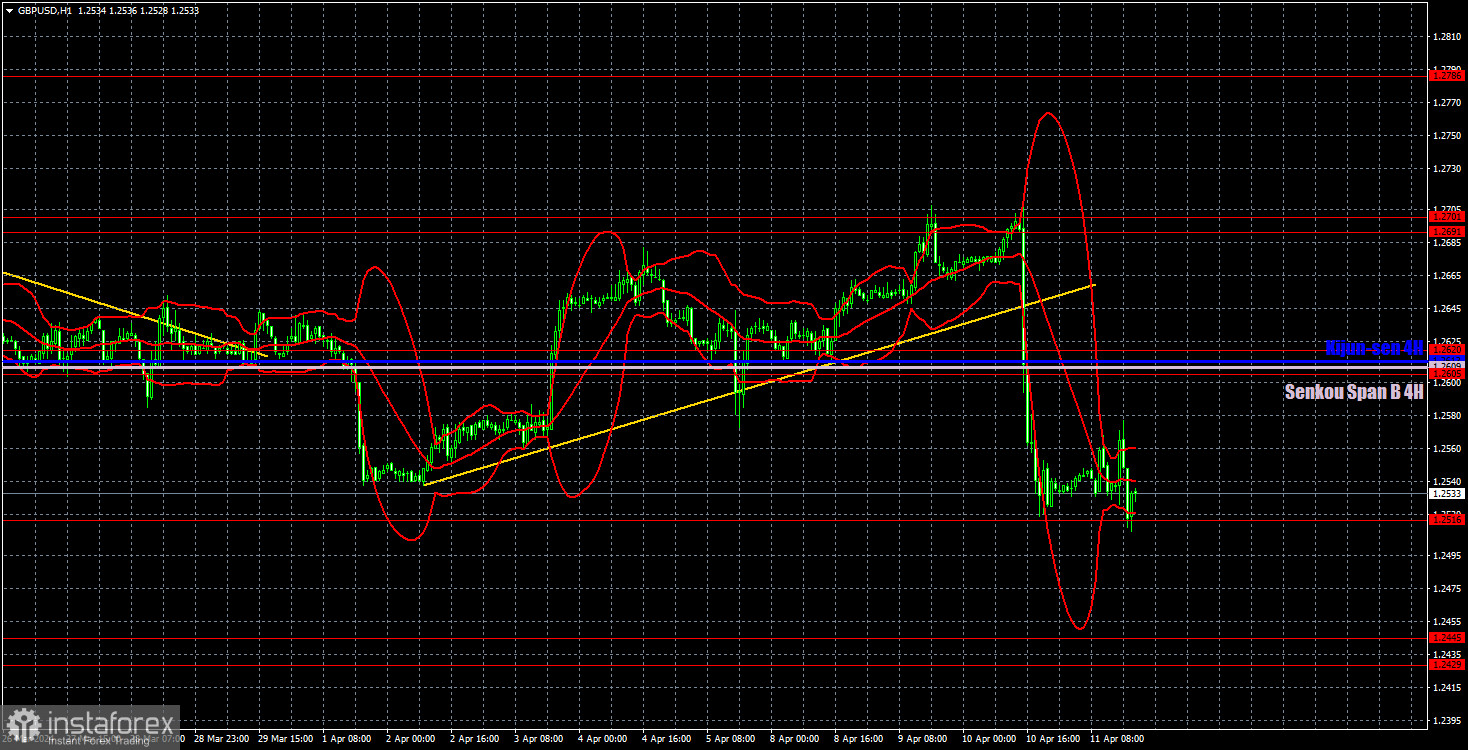
On the 1H chart, GBP/USD was forced to stop forming a new upward movement within the sideways channel of 1.25-1.28. If it weren't for the US inflation report, which was quite important, we probably would have seen the pound rise for several more weeks. Nonetheless, the sideways channel remains intact at the moment. To end the flat phase, the price must firmly consolidate below the level of 1.2516. The flat cannot last forever, but the level of 1.2516 is solid as a rock, and the market cannot handle it. Or simply doesn't want to.
As of April 12, we highlight the following important levels: 1.2215, 1.2269, 1.2349, 1.2429-1.2445, 1.2516, 1.2605-1.2620, 1.2691-1.2701, 1.2786, 1.2863, 1.2981-1.2987. The Senkou Span B (1.2609) and Kijun-sen (1.2613) lines can also serve as sources of signals. Don't forget to set a Stop Loss to breakeven if the price has moved in the intended direction by 20 pips. The Ichimoku indicator lines may move during the day, so this should be taken into account when determining trading signals.
On Friday, the UK will release reports on GDP and industrial production for February. These reports are not crucial. Most likely, they will provoke a muted market reaction, if any at all. Volatility has decreased again after Wednesday, so we do not expect strong movements today. The macroeconomic background in the US will also be weak, with only the University of Michigan Consumer Sentiment Index scheduled for release.
Description of the chart:
Support and resistance levels are thick red lines near which the trend may end. They do not provide trading signals;
The Kijun-sen and Senkou Span B lines are the lines of the Ichimoku indicator, plotted to the 1H timeframe from the 4H one. They provide trading signals;
Extreme levels are thin red lines from which the price bounced earlier. They provide trading signals;
Yellow lines are trend lines, trend channels, and any other technical patterns;
Indicator 1 on the COT charts is the net position size for each category of traders;
 English
 Русский
 Bahasa Indonesia
 Bahasa Malay
 ไทย
ไทย Español
 Deutsch
 Български
 Français
 Tiếng Việt
 中文
中文 বাংলা
বাংলা हिन्दी
 Čeština
 Українська
 Română

