EUR/USD

Higher Timeframes
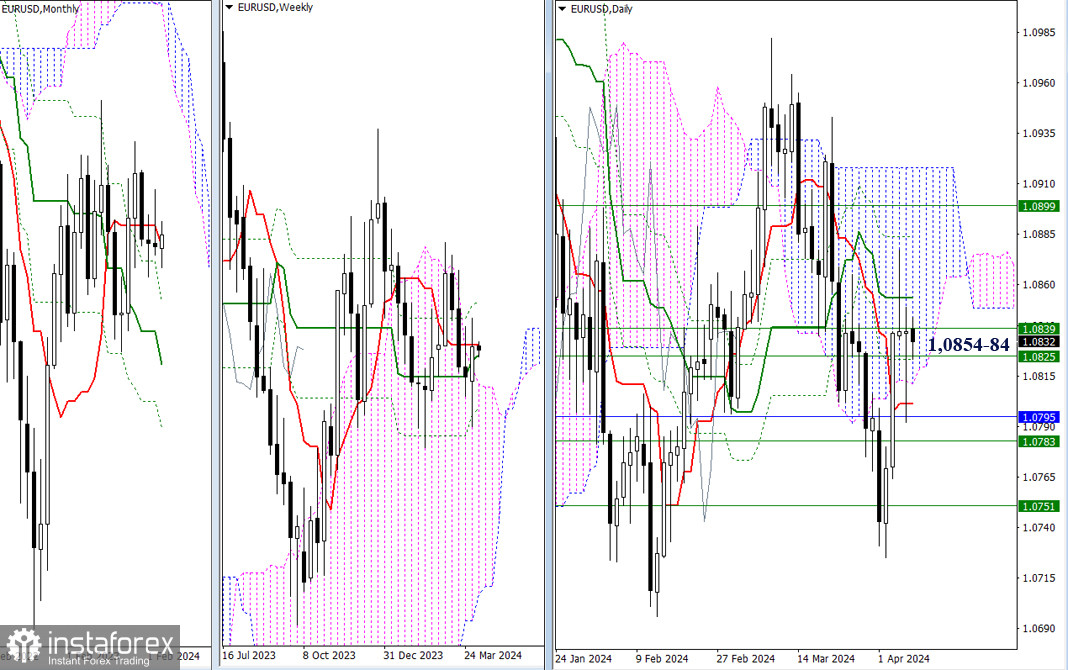
At the end of last week, the market couldn't determine its direction and priorities, casting long daily shadows both upwards and downwards, while remaining within the gravitational zone of the main levels of the weekly Ichimoku cross.
Today, the levels of the weekly cross (1.0825 – 1.0839) continue to exert their influence and attraction. The main tasks in this market segment have not undergone significant changes. For bulls, it is still important to eliminate the daily cross (1.0854 – 1.0884), overcome the weekly resistance (1.0899), and enter the bullish zone relative to the daily Ichimoku cloud (1.0918). For bears, it is important to return to the bearish zone relative to the daily cloud and overcome the nearest support zone, consolidating levels from different timeframes (1.0801 – 1.0795 – 1.0783). Next, the question of liquidating the weekly Ichimoku cross (1.0751) and updating the low (1.0725) will arise.

H4 – H1
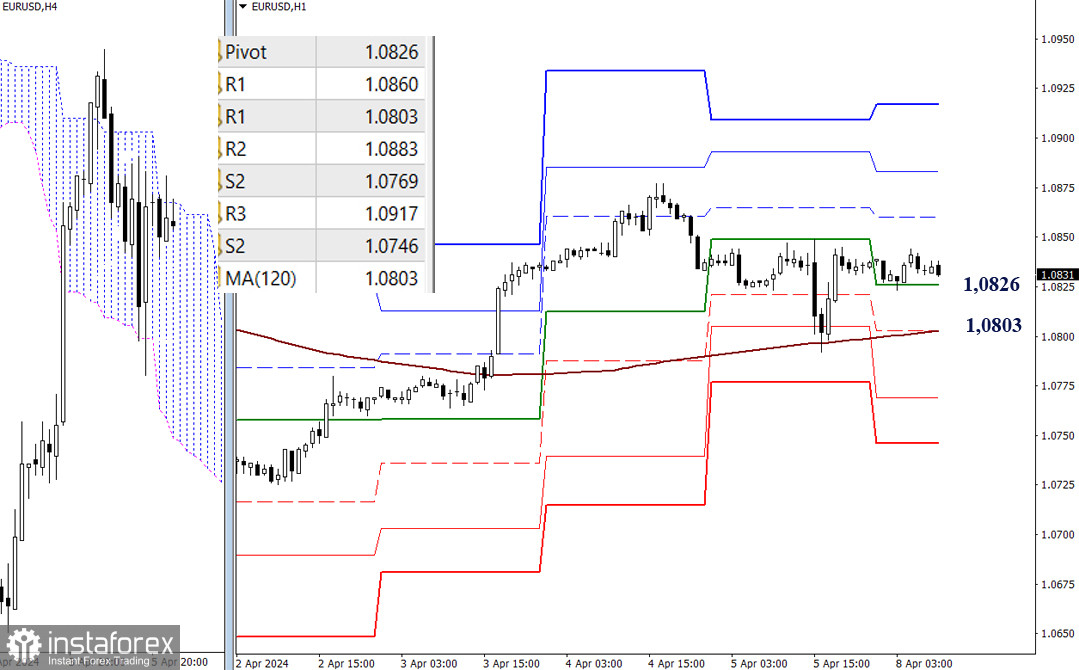
On lower timeframes, the pair is currently in a correction zone. Bulls maintain the main advantage, but they have already descended into the area of key supports, which will help them defend their interests during the correction, but breaking through the key levels will shift the main advantage to the bears' side.
Today's bullish targets are located at the levels of 1.0860 – 1.0883 – 1.0917 (resistances of classic pivot points). Key levels are at 1.0826 (central pivot point of the day) and 1.0803 (weekly long-term trend). Bearish targets today may be the supports of classic pivot points (1.0803 – 1.0769 – 1.0746).
***
GBP/USD

Higher Timeframes
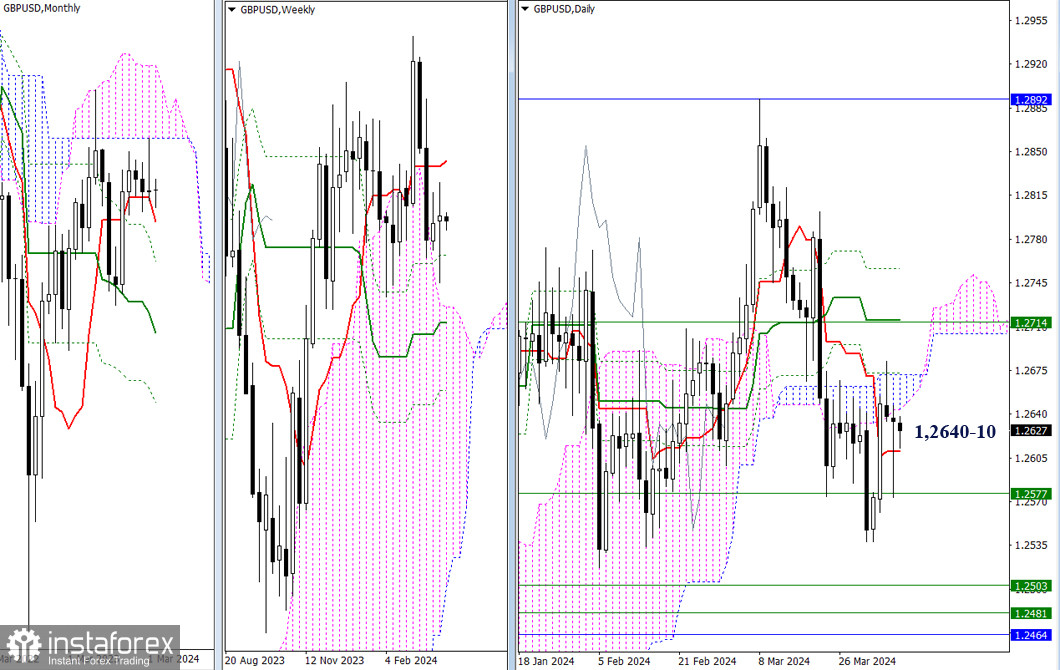
Last week failed to significantly change the existing balance of power. Despite attempts to break out, the market continues to concentrate around the daily cloud and short-term trend (1.2671 – 1.2640 – 1.2610). Changing the situation will help break out of the nearest benchmarks and develop movement.
The nearest bullish targets now are the final levels of the daily Ichimoku cross (1.2715 – 1.2757), reinforced by the weekly short-term trend at 1.0714. Bearish targets, after breaking through nearby boundaries 1.2577 – 1.2538 (weekly support + low).

H4 – H1
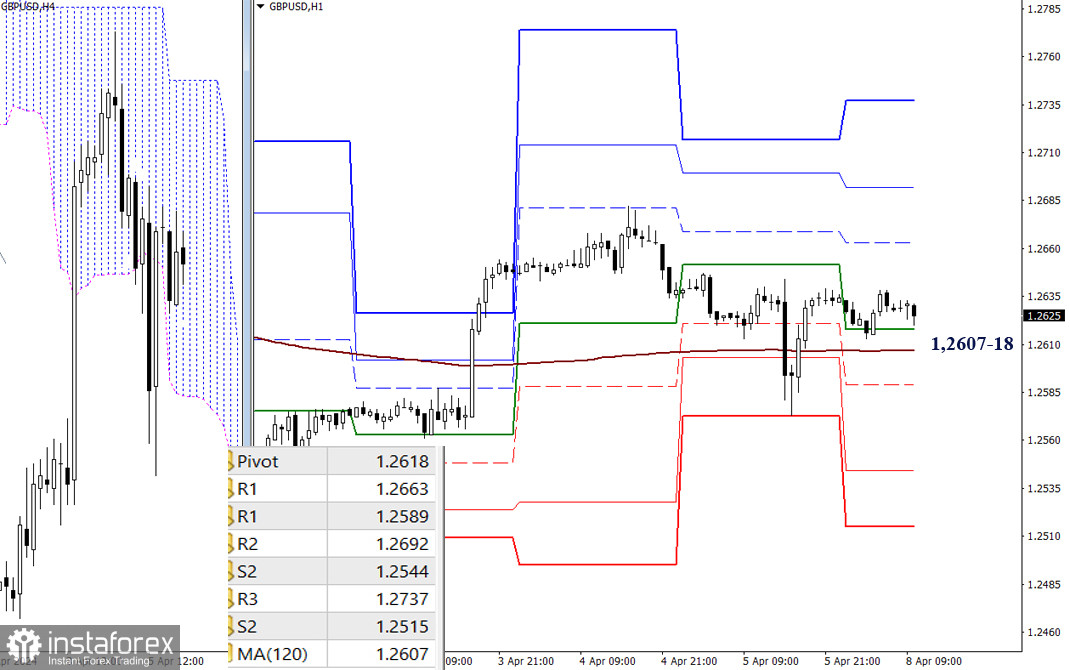
On lower timeframes, at the moment, the main advantage remains on the bulls' side. However, the bulls have a very weak position as they operate within the attraction zone of key levels 1.2607-18 (central pivot point of the day + weekly long-term trend), which are now almost horizontal. The location and work above these levels maintain the bullish advantage, its strengthening within the day is possible through the rise and testing of resistance levels of classic pivot points (1.2607-18). Breaking through key levels may direct the market towards bearish sentiments; movement at lower timeframes will pass through the supports of classic pivot points (1.2589 – 1.2544 – 1.2515).
***
The technical analysis of the situation uses:
Higher timeframes - Ichimoku Kinko Hyo (9.26.52) + Fibonacci Kijun levels
Lower timeframes - H1 - Pivot Points (classic) + Moving Average 120 (weekly long-term trend)
 English
 Русский
 Bahasa Indonesia
 Bahasa Malay
 ไทย
ไทย Español
 Deutsch
 Български
 Français
 Tiếng Việt
 中文
中文 বাংলা
বাংলা हिन्दी
 Čeština
 Українська
 Română

