The GBP/USD currency pair also traded higher on Thursday but was certainly much weaker than the day before. Volatility predictably decreased as the macroeconomic backdrop throughout the day was very weak. Essentially, traders could only focus on the second estimate of the UK Services Purchasing Managers' Index and the US initial jobless claims report. Neither the first nor the second reports had a significant impact on market sentiment.
And the sentiment right now is very simple - "bullish." After the pair once again failed to break out of the sideways channel, a new phase of upward movement began within the same channel, which has been maintained for 4 months now. Since we are dealing with a flat in the global scheme of things, the pair can now move towards 1.2800, which represents the upper boundary of the sideways channel on the 24-hour TF. In this case, there will be no connection with the macroeconomic backdrop for the pair. There will be no correlation with the EUR/USD pair. There will be no logical and reasoned movements.
We have repeatedly said recently that the British pound should only be falling. We also speculated that the Bank of England has started conducting currency interventions to prevent a new collapse of the British currency, which has been declining for 16 years. We have also repeatedly stated that the condition of the British economy is much weaker than that of the American one, and the Fed, constantly delaying the first rate cut, may eventually start the easing cycle at approximately the same time as the Bank of England. Thus, there are no grounds for the pound to rise now. And there haven't been any for quite some time.
Meanwhile, it became known that British citizens had lost trust in the Bank of England. Experts at Rabobank stated this. They noted that the British regulator had lost control over inflation, regularly shocked the market with wild forecasts, and constantly made communication errors with the public. As we can see, the Bank of England may have lost trust, but the pound sterling has not become any worse off from it. Let's think about what the market's reaction should be if consumers no longer trust the central bank. Usually, this means deposit outflows and selling off the national currency. But such economic regularities do not work in the case of the pound. And we still believe that the Bank of England is holding the pound's course itself because otherwise it would plummet.
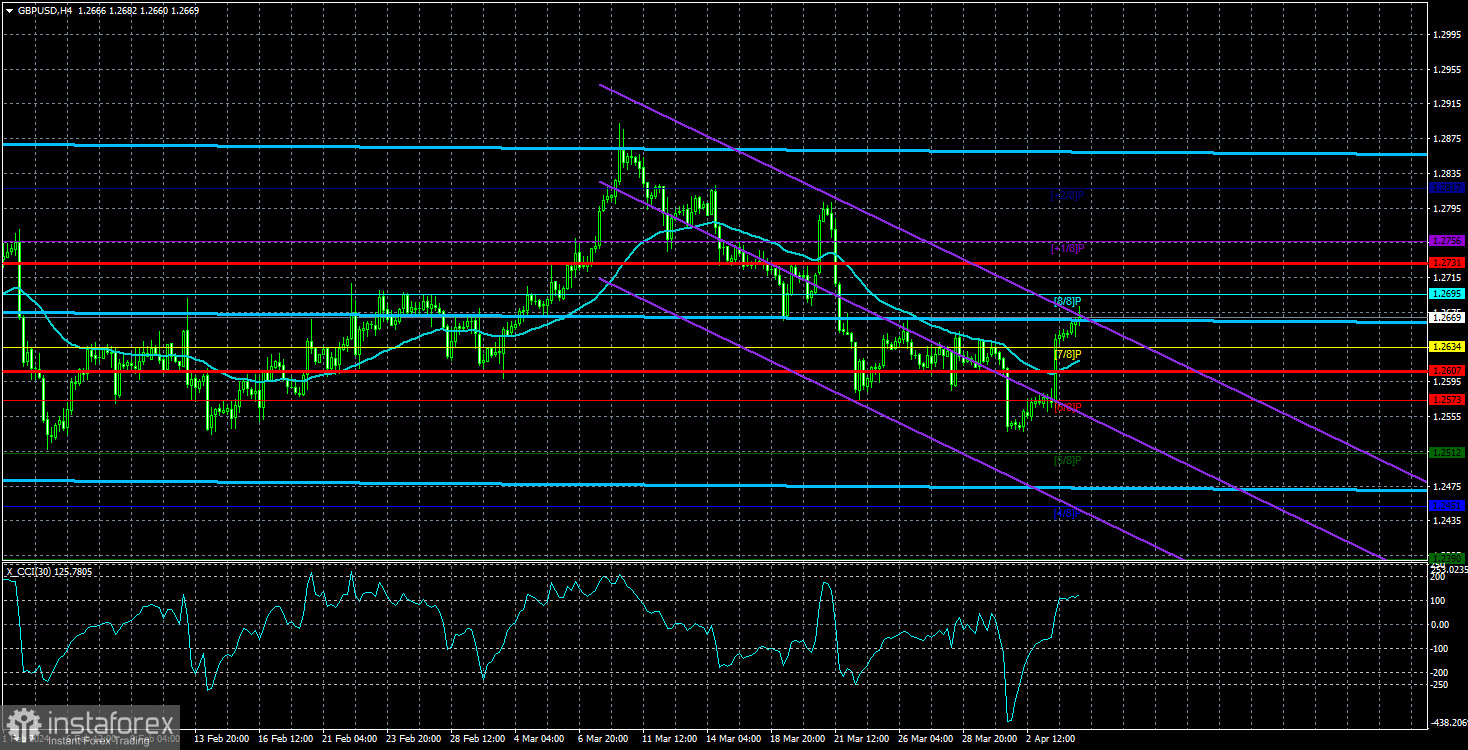
How long the Bank of England's support will continue is hard to say. How long the flat will continue is also still being determined. However, all traders should understand that a flat is never the most favorable time for trading. The CCI indicator indicated a possible upswing on Monday, which we are currently witnessing.

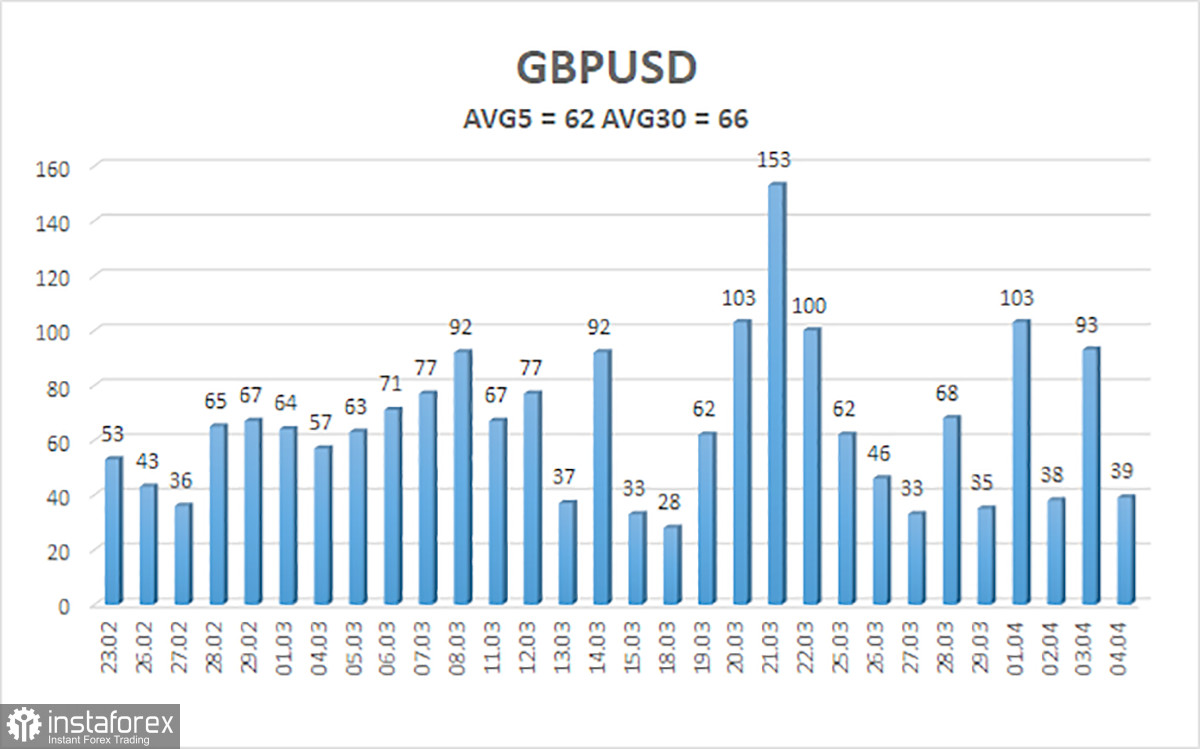
The average volatility of the GBP/USD pair over the last 5 trading days is 62 pips. For the pound/dollar pair, this value is considered "low." Thus, on Friday, April 5th, we expect movement within the range delimited by the levels 1.2607 and 1.2731. The senior channel of linear regression is still sideways, so there are no questions about the current trend. The CCI indicator entered the oversold area on Monday, which provoked the pair's rise. However, the market is still trading not too logically, which is not surprising for a flat that persists on the 24-hour TF.
Nearest support levels:
S1 – 1.2634
S2 – 1.2573
S3 – 1.2512
Nearest resistance levels:
R1 – 1.2695
R2 – 1.2756
R3 – 1.2817
Trading recommendations:
The GBP/USD pair continues to trade in a flat on the 24-hour TF. We still expect a move to the south with targets at 1.2512 and 1.2489, and the market still reluctantly buys the dollar and sells the pound, often ignoring fundamental and macroeconomic background. Therefore, it is necessary first for the flat to end and only then to analyze the technical picture for trading signals. Monday should not mislead traders with the fall of the British pound - the pair is still in a flat. Tuesday, Wednesday, and Thursday showed that a continuation still needs to be planned.
Explanations for the illustrations:
Linear regression channels - help determine the current trend. If both are directed in the same direction, it means the trend is currently strong.
The moving average line (settings 20.0, smoothed) - determines the short-term trend and the direction in which trading should currently be conducted.
Murray levels - target levels for movements and corrections.
Volatility levels (red lines) - the likely price channel in which the pair will spend the next day based on current volatility indicators.
CCI indicator - its entry into the oversold area (below -250) or the overbought area (above +250) indicates that a trend reversal is approaching in the opposite direction.
 English
 Русский
 Bahasa Indonesia
 Bahasa Malay
 ไทย
ไทย Español
 Deutsch
 Български
 Français
 Tiếng Việt
 中文
中文 বাংলা
বাংলা हिन्दी
 Čeština
 Українська
 Română

