EUR/USD

Higher Timeframes
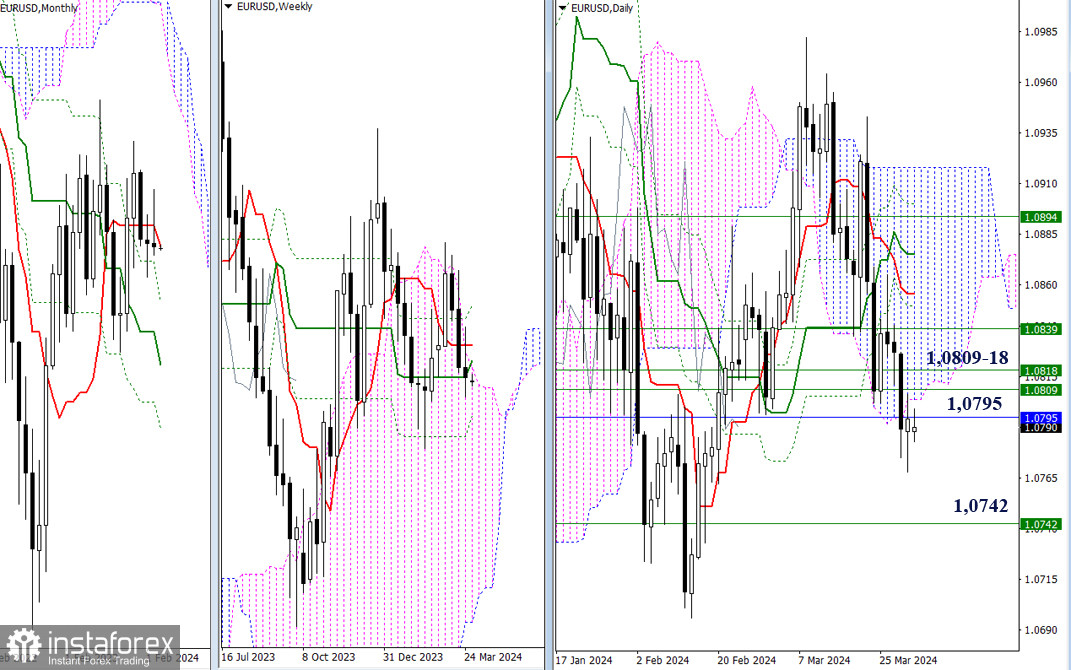
To sum up March—there's no progress, and uncertainty remains. Buyers couldn't break out of the monthly short-term trend nor utilize the supports of the golden cross of the weekly Ichimoku cloud. If the uncertainty zone is abandoned by bearish players now, their first task will be to eliminate the golden cross of the weekly Ichimoku cloud (1.0742). However, if bullish players continue their attempts to restore their positions, they will now face a very broad resistance zone, each of which could halt or delay further developments. The resistance zone is formed by levels of different timeframes: 1.0795 - 1.0809 - 1.0818 - 1.0839.

H4 - H1
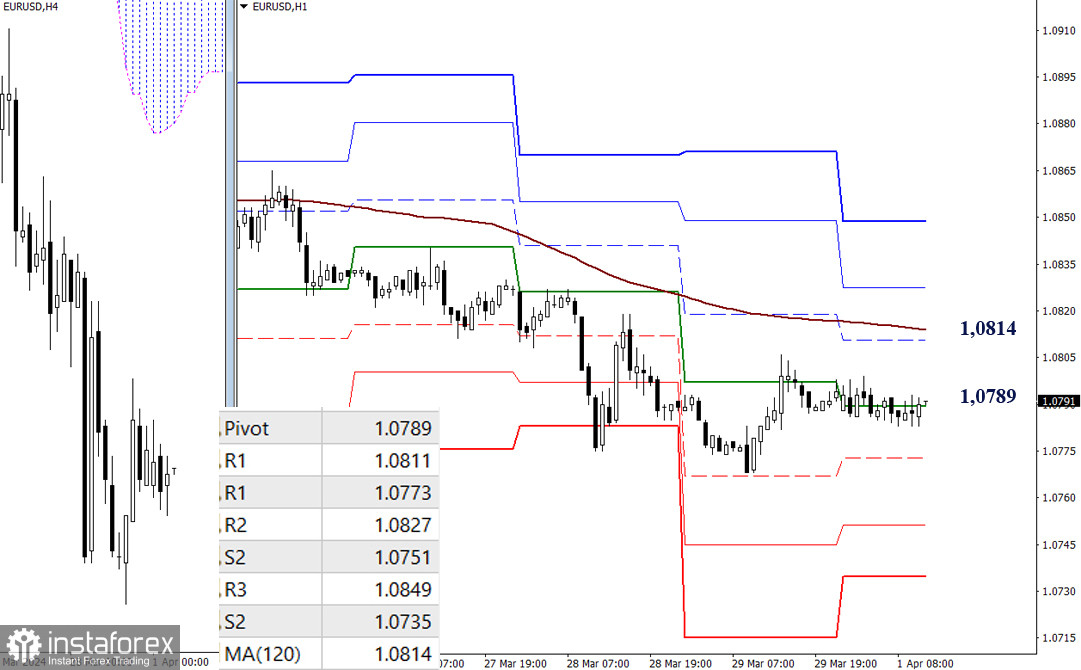
On lower timeframes, the pair is currently operating in a correction zone and under the influence of the central pivot point (1.0789). Continued upward movement will lead to testing of the weekly long-term trend (1.0814). Consolidation above it and a reversal of the moving average will change the current balance of power. The reference points in this case will be R2 (1.0827) and R3 (1.0849). Bearish activity and further decline will draw attention to the support levels of classic pivot points, which today are at 1.0773 - 1.0751 - 1.0735.
***
GBP/USD

Higher Timeframes
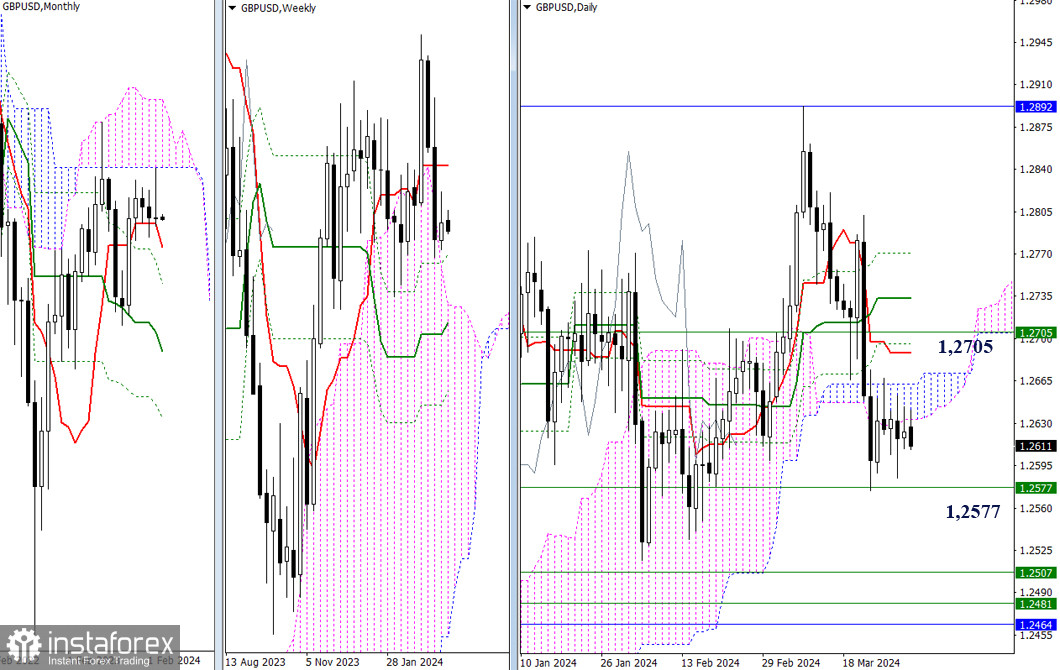
In March, bullish players tested the lower boundary of the monthly cloud and returned to the consolidation zone of the past few months, casting a long upper shadow. The upper target in April remains the same—the lower boundary of the monthly cloud (1.2892). On this path, bullish players will need to reclaim the weekly short-term trend (1.2705) and eliminate the daily Ichimoku Cross, the levels of which can now be noted at the boundaries of 1.2633 - 1.2662 - 1.2688 - 1.2733 - 1.2771. For bearish players, the nearest development of the situation hinges on 1.2577, and then the zone of support from the highest timeframes will be significant (1.2507 - 1.2481 - 1.2464) as well as the daily target for breaking through the Ichimoku cloud.

H4 - H1
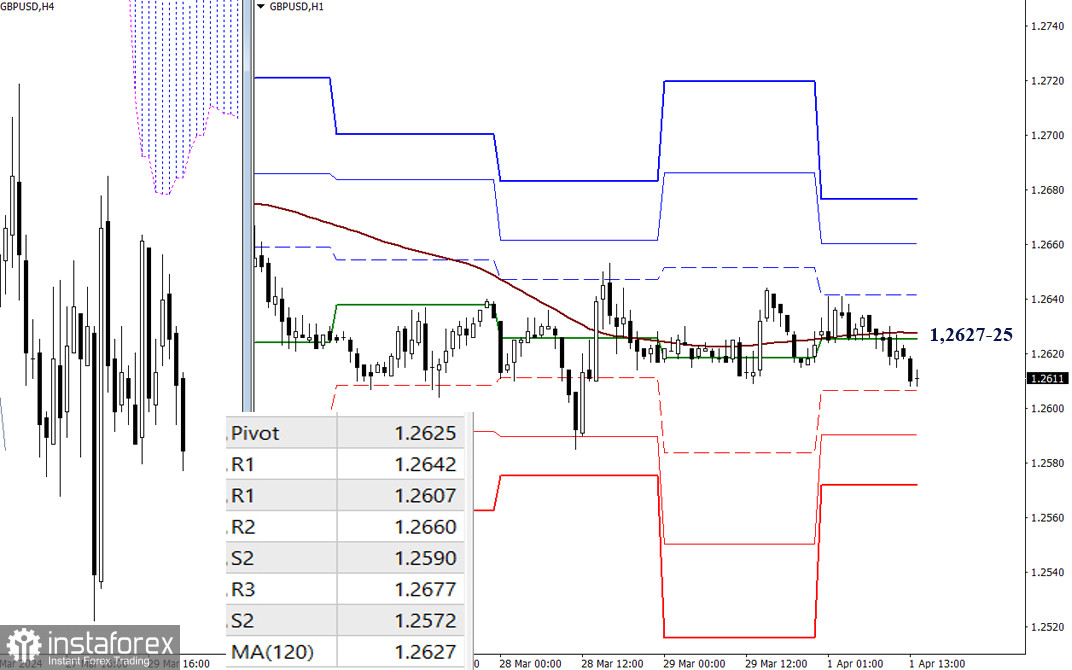
At the moment, on lower timeframes, the pound has consolidated below key levels, which today have joined forces in a narrow range of 1.2627-25 (central pivot point of the day + weekly long-term trend). With further decline, the pair will face testing of support levels from classic pivot points (1.2607 - 1.2590 - 1.2572). Bullish players can change the current balance of power if they rise above key levels and begin testing resistance from classic pivot points, which can now be noted at boundaries of 1.2642 - 1.2660 - 1.2677.
***
The technical analysis of the situation uses:
Higher timeframes - Ichimoku Kinko Hyo (9.26.52) + Fibonacci Kijun levels
Lower timeframes - H1 - Pivot Points (classic) + Moving Average 120 (weekly long-term trend)
 English
 Русский
 Bahasa Indonesia
 Bahasa Malay
 ไทย
ไทย Español
 Deutsch
 Български
 Français
 Tiếng Việt
 中文
中文 বাংলা
বাংলা हिन्दी
 Čeština
 Українська
 Română

