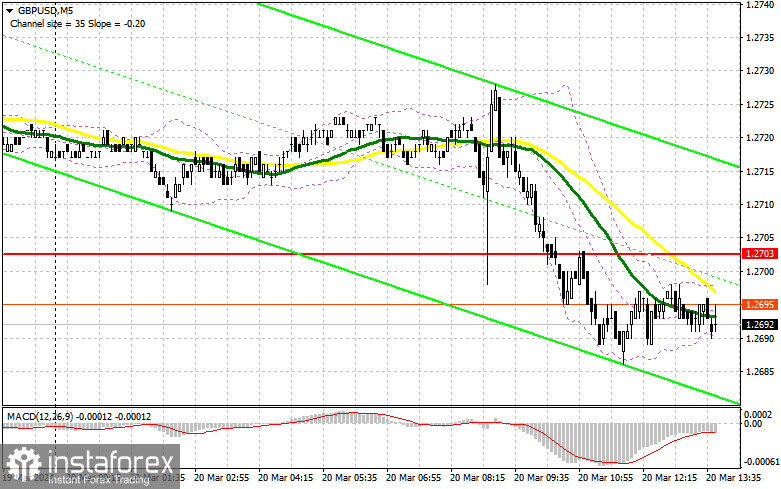
In my morning forecast, I highlighted the level of 1.2703 and planned to make trading decisions based on it. Let's look at the 5-minute chart and analyze what happened there. The decline and the formation of a false breakout led to the formation of a buying entry point, but I missed this signal because it was formed quite far from where a stop order could be placed. And considering the data that came out, it was even more difficult to expect the pair's continued growth. The technical picture was reassessed for the second half of the day.

For opening long positions on GBP/USD, the following is required:
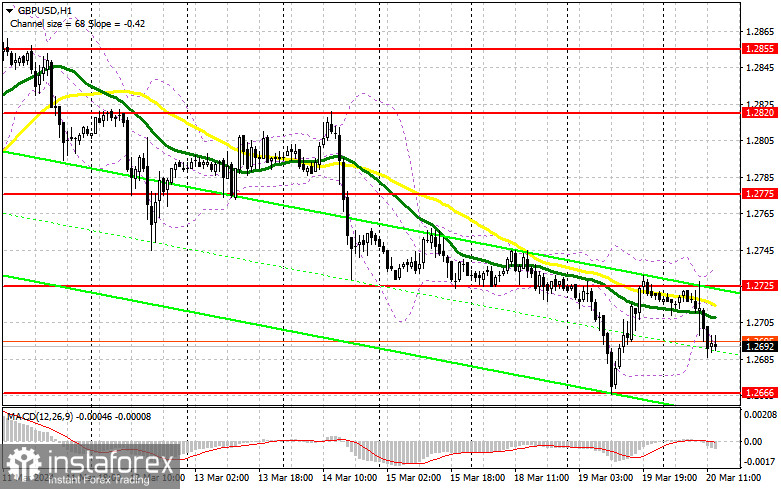
The news that annual inflation in the UK continued to decline, and the monthly inflation demonstrated less active growth than economists expected, triggered a drop in the pound. And although pressure on the pair continues, we have an important decision ahead from the Federal Reserve, so everything could change in a moment. The Fed's tough stance and Chairman Jerome Powell's hints at interest rate cuts in early summer are reasons to sell the dollar and buy the pound. In the event of a pair's decline, only the formation of a false breakout near the nearest support at 1.2666, similar to what I discussed earlier, will provide a suitable entry point for long positions, with the expectation of a pound demand rebound aiming for a refresh to 1.26725 – a new resistance formed at the end of the first half of the day. Breaking and consolidating above this range will strengthen bull positions and open the way to 1.2775. The ultimate target will be the maximum at 1.2820, where I plan to take profits. In the scenario of the pair's decline and the lack of activity from bulls at 1.2666, all of which will be possible in the case of a tough stance from the Fed, the pair will continue its decline. In this case, only a false breakout near the next support at 1.2636 will confirm the correct entry point into the market. I plan to buy GBP/USD immediately on a rebound from the minimum of 1.2600 with a target for a pair correction downwards by 30-35 points within the day.
For opening short positions on GBP/USD, the following is required:
Bears control the market. In the event of an attempt for the pair to rise, only a false breakout near the new resistance at 1.2725, where the moving averages intersect, will confirm the correct entry point for selling to continue the trend, leading to a downward movement towards 1.2666 – a support that plays a fairly important role in the current trend. Breaking and retesting from the bottom to the top of this range will deal another blow to buyer positions, leading to stop-loss triggering and opening the way to 1.2636. The ultimate target will be the area around 1.2600, where profits will be taken. In the event of GBP/USD's rise and the absence of activity at 1.2725 in the second half of the day, buyers will get a chance for a fairly strong rise in the pair. In this case, I will postpone selling GBP/USD until a false breakout occurs at the level of 1.2775. If there is no downward movement there, I will sell GBP/USD immediately on a rebound from 1.2820, but only with the expectation of a pair correction downwards by 30-35 points within the day.


Indicator signals:
Moving Averages
Trading is conducted below the 30 and 50-day moving averages, indicating further decline in the pair.
Note: The author considers the period and prices of moving averages on the H1 hourly chart and it differs from the general definition of classical daily moving averages on the D1 daily chart.
Bollinger Bands
In case of a decline, the lower boundary of the indicator around 1.2690 will act as support.
Description of Indicators
• Moving Average (determines the current trend by smoothing volatility and noise). Period 50. Marked in yellow on the chart.
• Moving Average (determines the current trend by smoothing volatility and noise). Period 30. Marked in green on the chart.
• MACD indicator (Moving Average Convergence/Divergence). Fast EMA period 12. Slow EMA period 26. SMA period 9.
• Bollinger Bands. Period 20.
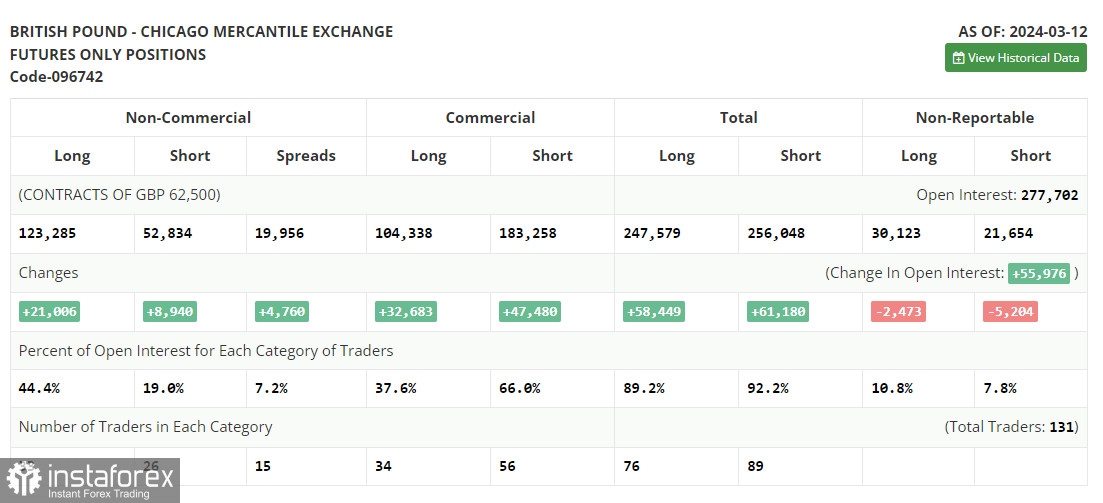
• Non-commercial traders - speculators such as individual traders, hedge funds, and large institutions using the futures market for speculative purposes and meeting certain requirements.
• Long non-commercial positions represent the total long open position of non-commercial traders.
• Short non-commercial positions represent the total short open position of non-commercial traders.
• The total non-commercial net position is the difference between short and long positions of non-commercial traders.
 English
 Русский
 Bahasa Indonesia
 Bahasa Malay
 ไทย
ไทย Español
 Deutsch
 Български
 Français
 Tiếng Việt
 中文
中文 বাংলা
বাংলা हिन्दी
 Čeština
 Українська
 Română

