GBP/USD
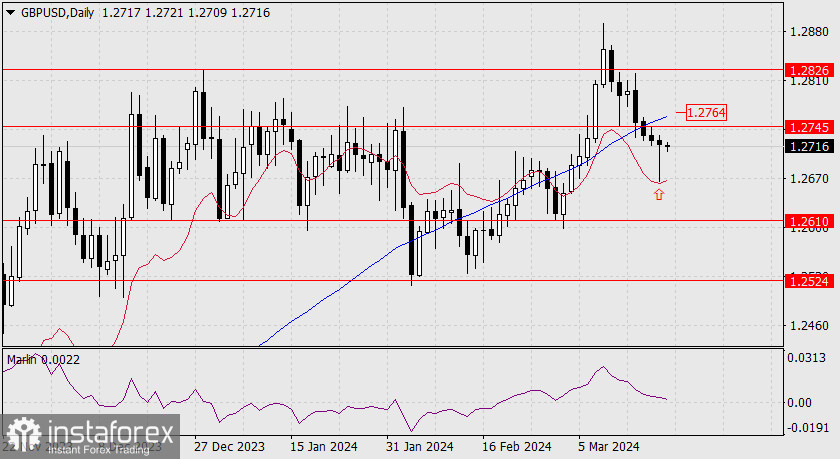
On the daily chart, the long lower shadow of the candlestick tested the balance indicator line and rebounded strongly from it to the upside. The Marlin oscillator managed to stay in the positive territory.

It may seem that the price has formed a stable low and is ready to turn into medium-term growth. However, unless the price overcomes the MACD indicator line (1.2764), which acts as a moving resistance, the conditions for medium-term growth will not be met. It may repeat the same situation on March 12-14, when the price plummeted after a similar long lower shadow. To develop a downward movement, GBP/USD must breach yesterday's low of 1.2666. The range of uncertainty is wide (100 pips), and the price may stay within this range even when the Federal Reserve meeting takes place, so we simply await the outcome of this meeting. The bullish scenario has the advantage.

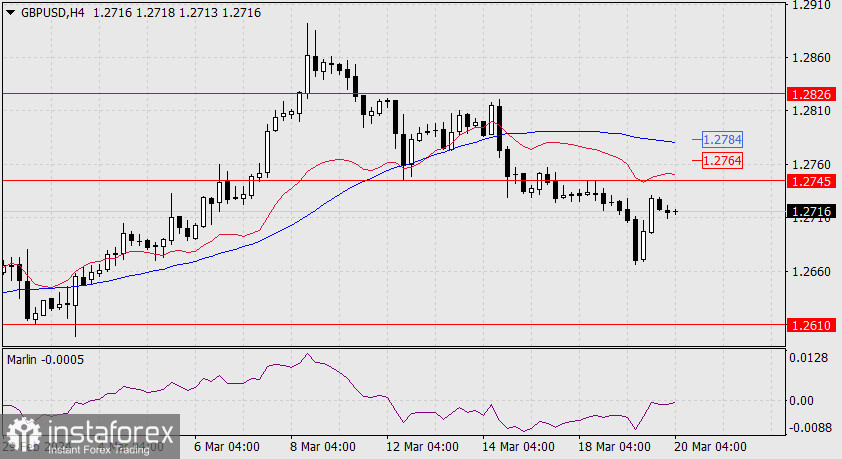
On the 4-hour chart, the Marlin oscillator is striving to exit the negative territory. It can do so when the price exceeds yesterday's high of 1.2731. A break above the resistance of 1.2745 will be a sign of its readiness to attack the MACD line on the daily time frame (1.2764), and then the 4-hour chart (1.2784). The target will be 1.2826 – the high of December 28, 2023.
 English
 Русский
 Bahasa Indonesia
 Bahasa Malay
 ไทย
ไทย Español
 Deutsch
 Български
 Français
 Tiếng Việt
 中文
中文 বাংলা
বাংলা हिन्दी
 Čeština
 Українська
 Română

