GBP/USD declined after the publication of GDP and industrial production volume data in the UK early today.
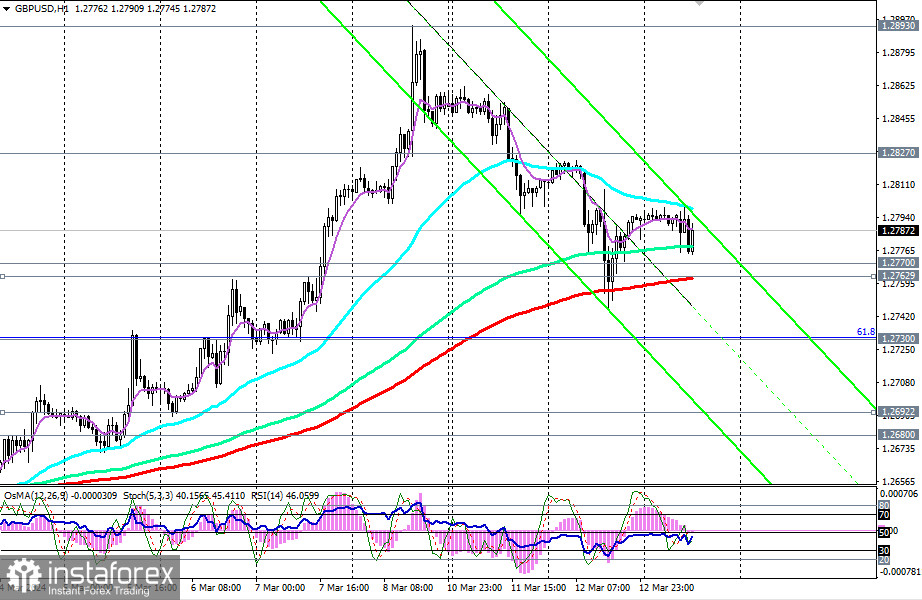
Nevertheless, this decline was moderate, and soon, the pair returned to an upward trajectory, almost reaching the opening price of today's trading day and the level of 1.2792 as of this writing.

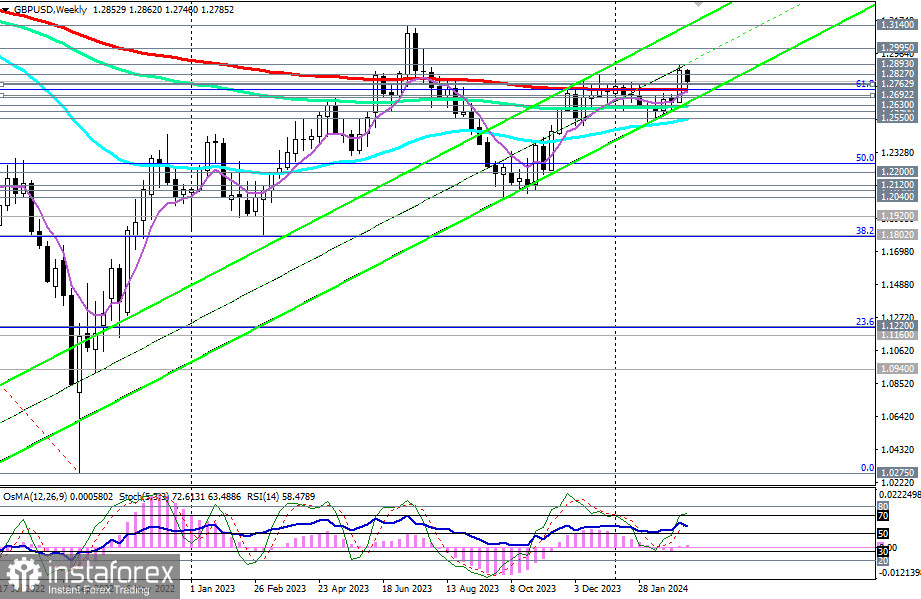
After breaking the key resistance level of 1.2730 last week (200 EMA on the weekly chart), the price entered a long-term bullish market zone, favoring long positions in GBP/USD.
In the case of further growth and a breakout of last week's high at 1.2893, GBP/USD will head towards the upper boundary of the upward channel on the weekly chart, near the 2023 high and the level of 1.3140.
A breakout of yesterday's high at 1.2823 will be the first signal for new long positions.

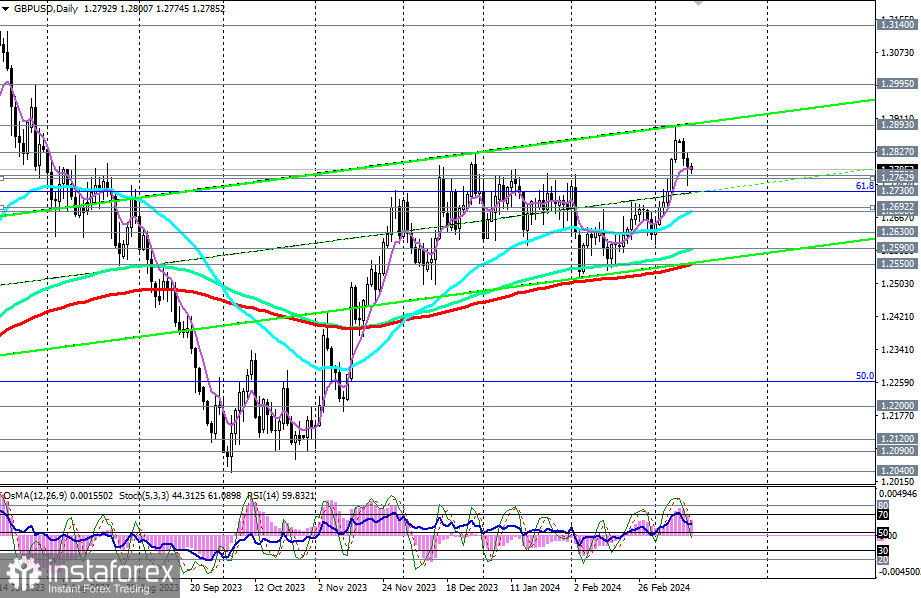
In an alternative scenario, a break below the local support level at 1.2770 and the important short-term support level at 1.2763 may trigger a decline in GBP/USD towards the key support level at 1.2730. Its breakthrough will return the price to the zone of a long-term bearish market with intermediate targets at support levels 1.2700, 1.2692 (200 EMA on the 4-hour chart), and 1.2680 (50 EMA on the daily chart).
Further decline and a breakthrough of key support levels at 1.2550 (200 EMA on the daily chart), 1.2500 will lead GBP/USD into the medium-term bearish market zone, making short long-term positions preferable.
Support levels: 1.2770, 1.2763, 1.2730, 1.2700, 1.2692, 1.2680, 1.2630, 1.2600, 1.2590, 1.2550, 1.2500
Resistance levels: 1.2800, 1.2827, 1.2860, 1.2890, 1.2900, 1.3000, 1.3100, 1.3140
Trading Scenarios:
Alternative Scenario: Sell Stop 1.2760. Stop-Loss 1.2830. Targets 1.2730, 1.2700, 1.2675, 1.2630, 1.2600, 1.2585, 1.2550, 1.2500
Main Scenario: Buy Stop 1.2830. Stop-Loss 1.2760. Targets 1.2860, 1.2890, 1.2900, 1.3000, 1.3100, 1.3140
"Targets" correspond to support/resistance levels. This does not necessarily mean they will be reached, but can serve as a guide when planning and placing trading positions.
 English
 Русский
 Bahasa Indonesia
 Bahasa Malay
 ไทย
ไทย Español
 Deutsch
 Български
 Français
 Tiếng Việt
 中文
中文 বাংলা
বাংলা हिन्दी
 Čeština
 Українська
 Română

