EUR/USD

Higher Timeframes
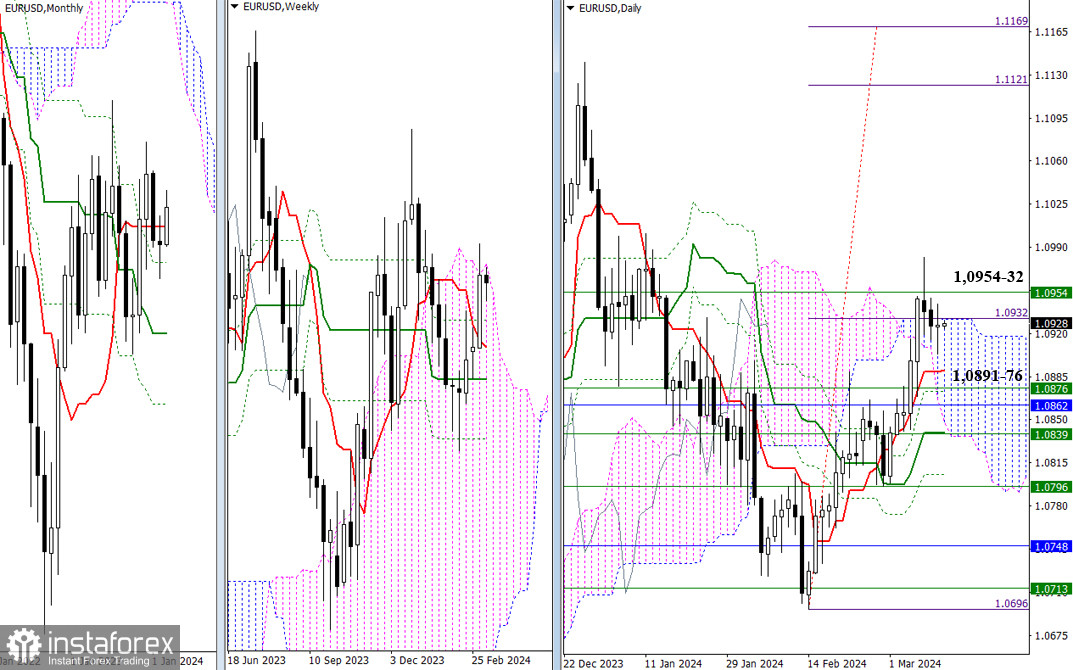
The previous day ended with a candle of uncertainty, and parts of the market tuned to bearish sentiments managed to deepen the corrective decline. As a result, the main plans and expectations remain relevant. The development of bearish sentiments in this area in the near term is still associated with testing and passing through a broad support zone located at the levels of 1.0891 – 1.0876 – 1.0892 – 1.0839, uniting levels of different timeframes. The primary task for bullish players remains the breakout and consolidation in the bullish zone relative to the Ichimoku clouds of the daily (1.0932) and weekly (1.0954) timeframes.

H4 – H1
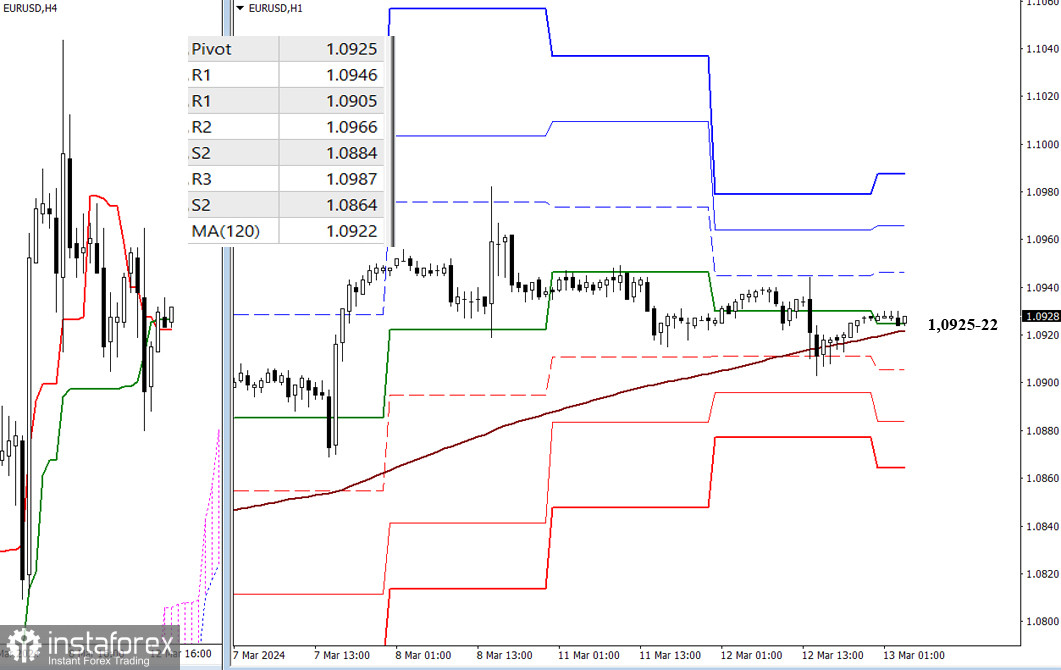
Yesterday, bearish players tested the support of the weekly long-term trend but could not overcome it. Today, the trend (1.0922) continues to restrain the decline, defending the interests of bullish players. This level represents the current balance of power, so its breakout and reversal can influence a change in market sentiments and priorities. Additional intraday benchmarks are the classic pivot points. For bullish players, resistances are crucial, currently at 1.0946 – 1.0966 – 1.0987. For bearish players, supports are significant, currently at 1.0905 – 1.0884 – 1.0864.
***
GBP/USD

Higher Timeframes
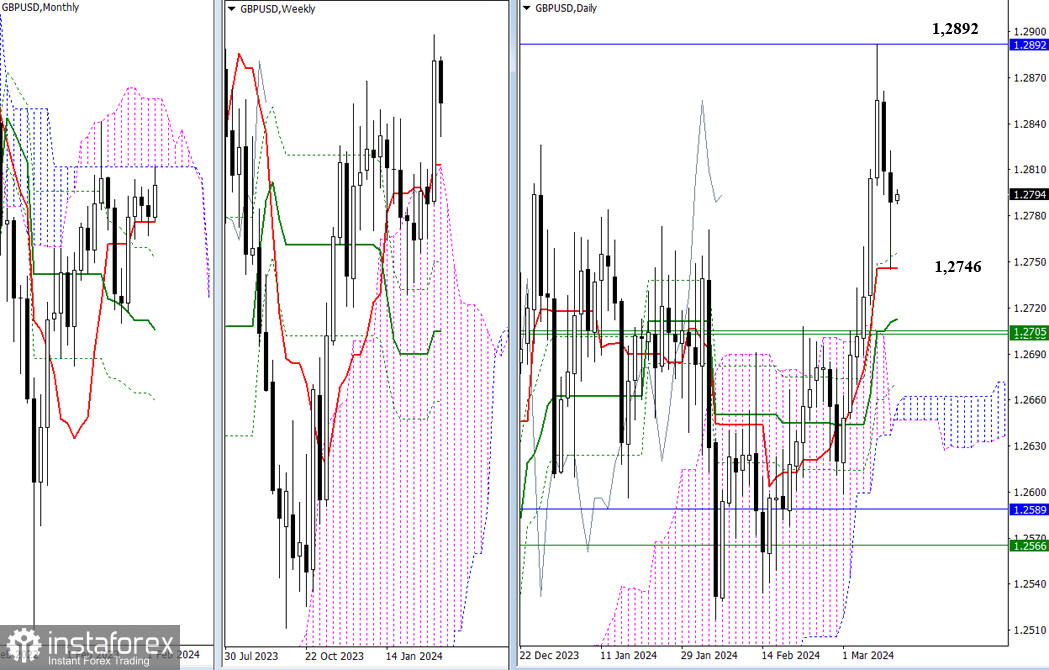
Yesterday, bearish players were able to realize a corrective decline to the first target – the daily short-term trend (1.2746). In the case of further correction, the next important level will be the range of 1.2713 – 1.2702, combining the daily medium-term trend, weekly short-term trend, and the upper boundary of the weekly cloud. If bullish players attempt to complete the ongoing correction in the near term, they will need to retest and overcome the resistance of the lower boundary of the monthly cloud (1.2892).

H4 – H1
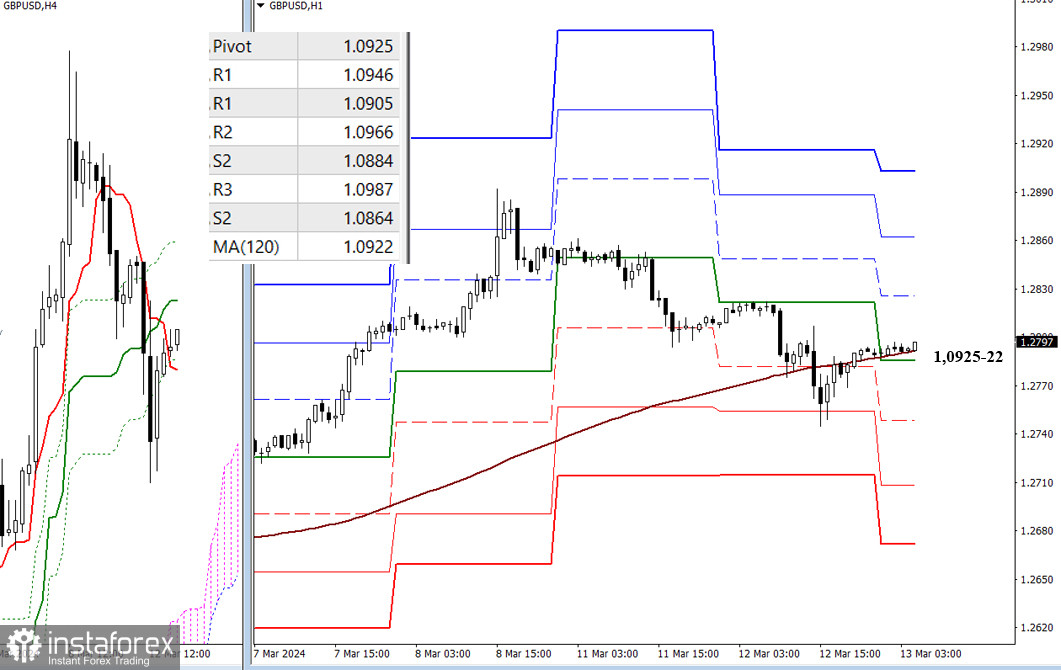
On the lower timeframes, there is currently a struggle for the key level – the weekly long-term trend (1.0922). Possession of this level provides a significant advantage, so trading above this threshold will strengthen bullish sentiments, while trading below the level will develop bearish sentiments and advantages. The benchmarks for continuing active intraday movement are the classic pivot points. Thus, the interests of bullish players will be focused on overcoming resistances at 1.2826 – 1.2862 – 1.2903, while the attention of bearish players will be on supports at 1.2749 – 1.2708 – 1.2672.
***
The technical analysis of the situation uses:
Higher timeframes - Ichimoku Kinko Hyo (9.26.52) + Fibonacci Kijun levels
Lower timeframes - H1 - Pivot Points (classic) + Moving Average 120 (weekly long-term trend)
 English
 Русский
 Bahasa Indonesia
 Bahasa Malay
 ไทย
ไทย Español
 Deutsch
 Български
 Français
 Tiếng Việt
 中文
中文 বাংলা
বাংলা हिन्दी
 Čeština
 Українська
 Română

