 English
  Русский
 Bahasa Indonesia
 Bahasa Malay
 ไทย
ไทย Español
 Deutsch
 Български
 Français
 Tiếng Việt
 中文
中文 বাংলা
বাংলা हिन्दी
 Čeština
 Українська
 Română

USD/JPY
On the daily chart, the pair has settled below the MACD line. The lack of desire to continue its decline on Monday makes the MACD line (147.56) the nearest resistance for a corrective movement. Once the correction ends (or without it), we expect support to be tested at 145.99, the peak from January 5.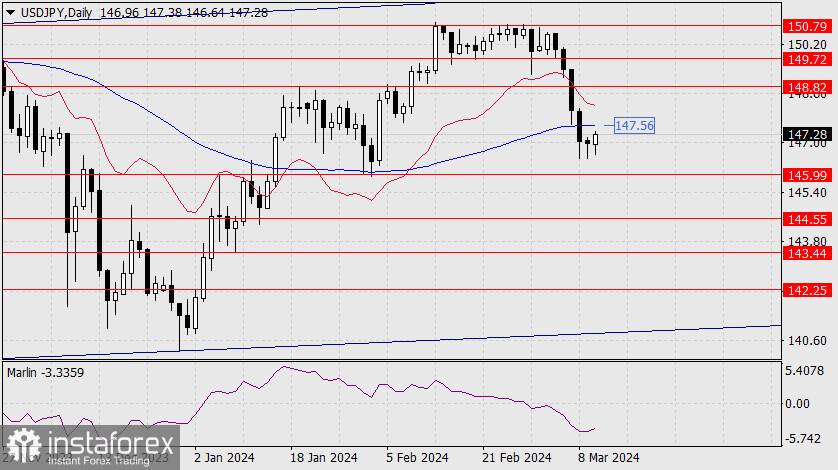
Consolidation below this level will open up the target of 144.55. The pair is following a downtrend.
On the 4-hour chart, the Marlin oscillator is clearly indicating a price reversal into a correction. If it has no intention of rising above the zero line and consolidating above it, we expect a reversal from the border of the growth territory.
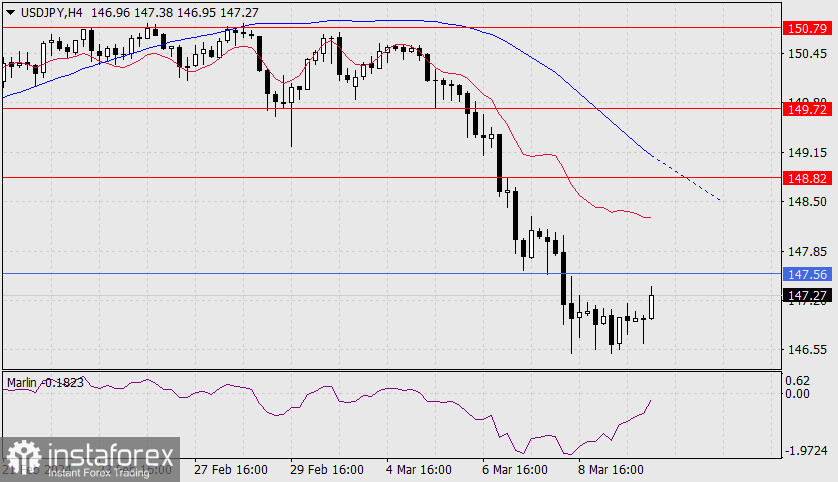
By this time, the price will have had a chance to test the resistance at 147.56. This is the main scenario.
If the price manages to consolidate above 147.56, then the price may correct higher until it reaches the target level of 148.82, with the MACD line providing support.